Difference between revisions of "ISSS608 2017-18 T3 Assign Wang Runyu Data Visualization"
Jump to navigation
Jump to search
| Line 29: | Line 29: | ||
===Pattern of Different Quarter=== | ===Pattern of Different Quarter=== | ||
| − | ===Pattern | + | ===Pattern Around Dumping Site=== |
==Q2== | ==Q2== | ||
Revision as of 22:35, 7 July 2018
 VAST Mini Challenge 1: "Cheep" Shots?
|
|
|
|
|
Patterns of all of the bird species
Overview Patterns
Pattern of Different Quarter
Pattern Around Dumping Site
Q2
Visual Analytical Approach
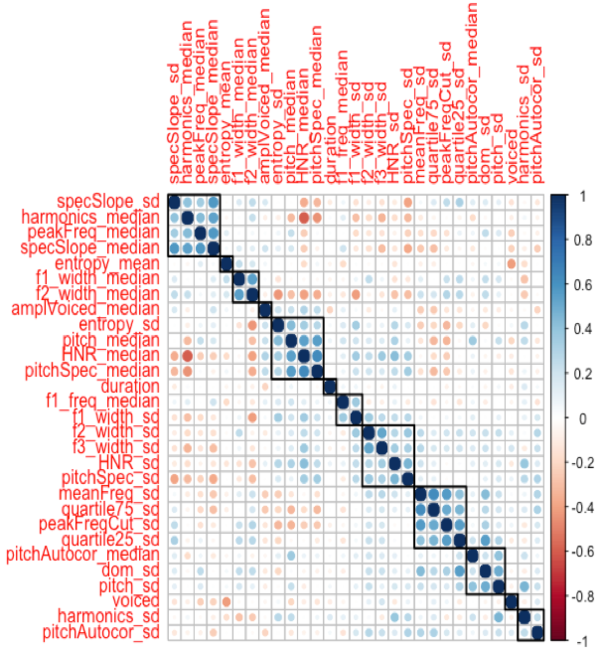
As the text format outcome from seewave package(analyzeFolder function) contains 69 features, it is not practical for us to analyze all the features visually. In the first step, I use findCorrelation() function to eliminate highly correlated features. I set the pair-wise absolute correlation cut off to 0.6.
Correlation Plot
remove features based on corr plot observations

Corrplot, select variables, we not only consider to check the variables nearby, but all the variables For example, group of 'specSlape_sd', 'harmonics_median', 'peakFreq_median', I choose 'peakFreq_median'.
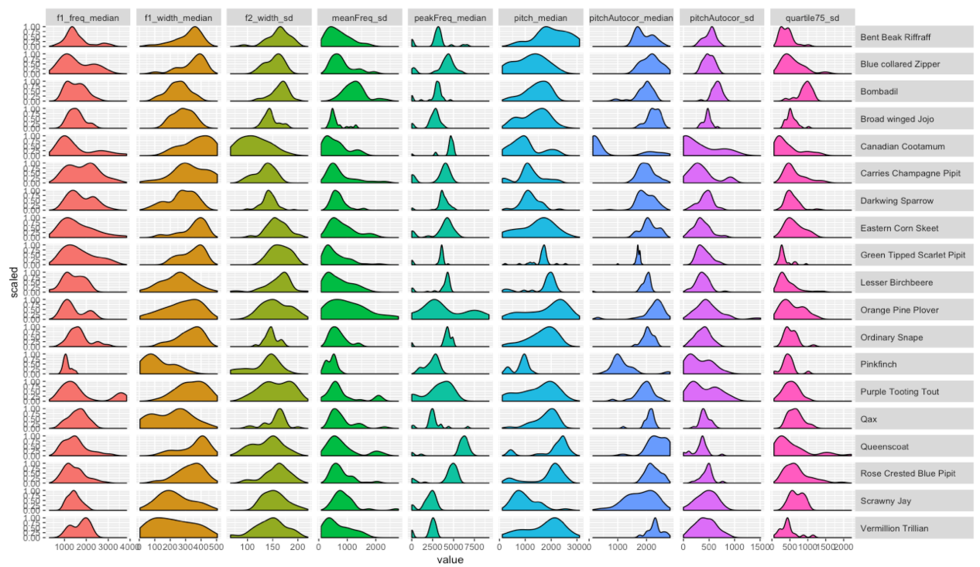
Trellis Plot for Variable Density
