Difference between revisions of "ISSS608 2017-18 T3 Assign Liu Yuanjing Methodology"
Yjliu.2017 (talk | contribs) |
Yjliu.2017 (talk | contribs) |
||
| Line 1: | Line 1: | ||
| + | <!----------- Main Header ------------> | ||
<div style=background:#f2ebd2;> | <div style=background:#f2ebd2;> | ||
[[Image:Water pollution.jpg|250px]] | [[Image:Water pollution.jpg|250px]] | ||
<font size = 5; color="#751102"><span style="font-family:Segoe UI Semibold";> Investigating chemical contamination in the Boonsong Lekagul waterways</span> | <font size = 5; color="#751102"><span style="font-family:Segoe UI Semibold";> Investigating chemical contamination in the Boonsong Lekagul waterways</span> | ||
</font></div> | </font></div> | ||
| − | + | ||
| − | |||
| − | |||
| − | |||
| − | |||
| − | |||
| − | |||
| − | |||
| − | |||
| − | |||
| − | |||
| − | |||
| − | |||
| − | |||
| − | |||
| − | |||
| − | |||
| − | |||
| − | |||
| − | |||
| − | |||
| − | |||
| − | |||
| − | |||
| − | |||
| − | |||
==<font size="5"><font color="#000000">'''Tools'''</font></font>== | ==<font size="5"><font color="#000000">'''Tools'''</font></font>== | ||
Revision as of 20:24, 7 July 2018
Tools
|
Methodology
|
Methodology |
Description |
|
|
Standardization method: |
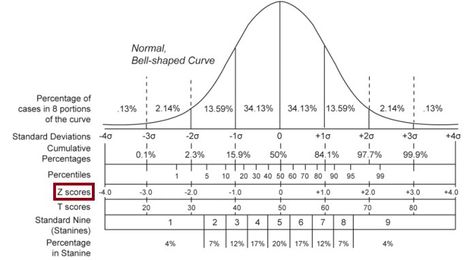
Because we want to go through all measures in different waterways or locations but measures have different units and if we want see the volatility changes in different paths or location and then identify potential chemical contamination. Therefore, we decided to use Z-Score to modify the data bias. Z-score represents the distance of the original data from the mean, and the standard of the distance measure is the standard deviation.
If the amount of statistical data is sufficient, the Z-score data distribution is satisfied, 68% of the data is distributed between "-1" and "1", and 95% of the data is distributed between "-2" and "2", 99%. The data is distributed between "-3" and "3". You can use this to verify your data. See the Z-score data distribution below: and then we edit the formula in tableau and add one measure variable, called “Z-Score”, the formula as below:
| |

