Difference between revisions of "ISSS608 2017-18 T3 Assign Alejandro Llorens Moreno"
| Line 1: | Line 1: | ||
<div style=background:#F6CECE border:#A3BFB1> | <div style=background:#F6CECE border:#A3BFB1> | ||
| − | [[Image: | + | [[Image:Waterways Final.jpg|165px]] |
<b><font size = 6; color="#8B4513"> Mini-Challenge 2 Overview: Like a Duck to Water </font></b> | <b><font size = 6; color="#8B4513"> Mini-Challenge 2 Overview: Like a Duck to Water </font></b> | ||
</div> | </div> | ||
| Line 48: | Line 48: | ||
<gallery> | <gallery> | ||
| − | File:Waterways Final | + | File:Waterways Final.jpg|Caption1 |
</gallery> | </gallery> | ||
Revision as of 14:53, 7 July 2018
 Mini-Challenge 2 Overview: Like a Duck to Water
|
|
|
|
|
To be a Visual Detective
The Kasios furniture company has been implicated in environmental damage to the Boonsong Lekagul Wildlife Preserve. Kasios deny all accusations of industrial waste dumpling. Last year, Kasios spokesperson reassured that there isn’t any ground contamination near the remote ranger station suggested by the analysis.
Professors from Mistford College went to the site themselves to take samples. However, soil samples were inconclusive and investigators have taken a different approach.
The task of this project is to investigate the hydrology data from across the preserve. The Mistford College of Hydrology have come forwad with several years of water sensor readings from rivers in the preserve.
My task has been to investigate such samples.
The given dataset looks like this:
- FirstExcel.jpg
Figure1: sample of the dataset given
- SecondExcel.jpg
Figure2: Sample of the second dataset given
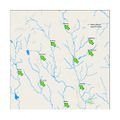
Caption1
Figure3: Snapshot of the map given.
Questions:
1. Trends: Characterize the past and most recent situation with respect to chemical contamination in the Boonsong Lekagul waterways. Do you see any trends of possible interest in this investigation? Your submission for this questions should contain no more than 10 images and 1000 words.
2. Anomalies: What anomalies do you find in the waterway samples dataset? How do these affect your analysis of potential problems to the environment? Is the Hydrology Department collecting sufficient data to understand the comprehensive situation across the Preserve? What changes would you propose to make in the sampling approach to best understand the situation? Your submission for this question should contain no more than 6 images and 500 words.
3. Conclusions: After reviewing the data, do any of your findings cause particular concern for the Pipit or other wildlife? Would you suggest any changes in the sampling strategy to better understand the waterways situation in the Preserve? Your submission for this question should contain no more than 6 images and 500 words.