Difference between revisions of "Group19 Proposal"
| Line 1: | Line 1: | ||
| + | LINK TO PROJECT GROUPS:<br /> | ||
| + | Please Click Here -> [https://wiki.smu.edu.sg/1718t3isss608/Project_Groups] | ||
| + | |||
| + | <!--MAIN HEADER --> | ||
| + | [[File:Group19_background.jpg|centre]] | ||
| + | <div style="background:#C33213; border:#002050; padding-left:15px; text-align:center;"> | ||
| + | <font size = 5; color="#000000"><span style="font-family:Century Gothic;">Sex Ratio At Birth in China | ||
| + | </span></font> | ||
| + | </div> | ||
| + | |||
| + | <!--MAIN MENU --> | ||
| + | {|style=background-image:"linear-gradient(#fff, #ccc)"; background-color:"#222;" width="100%" cellspacing="0" cellpadding="0" valign="top" border="5" border-width="10" | | ||
| + | | style="font-family:'Droid Sans', sans-serif;; font-size:125%; solid:#1B338F; background:#222; text-align:center;" width="12%" | | ||
| + | ; | ||
| + | |||
| + | [[Group19_Proposal|<font color="#C33213">Proposal</font>]] | ||
| + | |||
| + | | style="font-family:'Droid Sans', sans-serif;; font-size:125%; solid #1B338F; background:#222; text-align:center;" width="12%" | | ||
| + | ; | ||
| + | |||
| + | [[Group19_Poster| <font color="#C33213">Poster</font>]] | ||
| + | |||
| + | | style="font-family:'Droid Sans', sans-serif;; font-size:125%; solid #1B338F; background:#222; text-align:center;" width="12%" | | ||
| + | ; | ||
| + | |||
| + | [[Group19_Application| <font color="#C33213">Application</font>]] | ||
| + | |||
| + | | style="font-family:'Droid Sans', sans-serif;; font-size:125%; solid #1B338F; background:#222; text-align:center;" width="12%" | | ||
| + | ; | ||
| + | |||
| + | [[Group19_Report| <font color="#C33213">Report</font>]] | ||
| + | |} | ||
| + | |||
==Male or Female, that is a question!!== | ==Male or Female, that is a question!!== | ||
Revision as of 20:42, 14 August 2018
LINK TO PROJECT GROUPS:
Please Click Here -> [1]
Sex Ratio At Birth in China
|
|
|
|
|
Male or Female, that is a question!!
Motivation
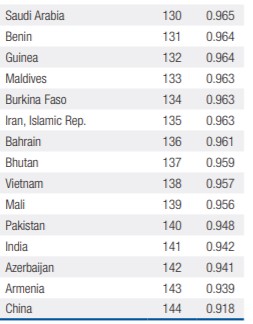
Based on “The Global Gender Gap Report 2017”, China remains the world’s lowest ranked country with regard to the gender gap in its sex ratio at birth(1-a). Tracing back to previous census data and demographic statistics, sex ratio at birth in China has been on the high side since the early 1980s and rising continuously. “In the human species the ratio between males and females at birth is slightly biased towards the male sex. The natural “sex ratio at birth is often considered to be around 105. This means that at birth on average, there are 105 males for every 100 females.” “The sex ratio of total population is expected to equalize at 0.9445(female-to-male ratio) . But in the third, fourth, fifth and sixth censuses, the sex ratios at birth in China is 108.5, 111.3, 116.9 and 118.1, respectively. China has become the populous nation with highest sex ratio at birth and in most serious gender imbalance situation. We try to find out the socio-economic and cultural factors that leading to the increase of the sex ration at birth, which may be meaningful to curb the increase of birth sex ratio and restore it to normal level.
Objectives
Data Discovery
Based on the previous research, we explore the data from sixth census preliminarily, detect the expected and discover the unexpected patterns of sex ratio at birth from massive data, and select the variables related to sex ratio at birth.
Uncovering Relationships
We build up model to uncover the between the sex ratio at birth and the selected variables and verify the relationship by statistic test.
Data Visualization
Design the data visualization to show the relationship between sex ratio at birth and other factors from the time and spatial dimension.
Data description
Our data are mainly obtained from the Sixth Census of China (1st Nov, 2009-31st Oct,2010) and Chinese Statistical Yearbook in 2011. The details of the dataset are shown as follows:
| The Sixth Census of China |
|---|
| 1.1-1 Number of households, population and sex ratio by province |
| 1.1-5 Population of agricultural households and non-agricultural households by sex and province |
| 2.1-3 Population by sex, age and province |
| 2.1-4 Population by sex, age |
| 2.6-1 Number of newborn by sex, child order and province |
| 2.6-2 Number of childbearing women by age, child order and level of education |
| 2.6-11 Average number of live birth and survived children of women aged 15-64 by regions |
| 2.6-13 Average number of live birth and survived children of women aged 15-64 by education level |
| Chinese Statistical Yearbook, 2011 |
| 3-10 Comparison of Population with Various Education Attainment Per 100 000 Persons by Region |
| 3-7 Total Population and Sex Ratio by Region |
| 10-15 Per Capita Annual Income of Urban Households by Sources and Region (2010) |
| 3-4 Total population and birth rate, death rate, natural growth rate by region, 2010 |
| 21-7 Number of Beds in Health Institutions per 1000 Population by Region (2010) |
Methodology
IDEA Method
Detect the expected and discover the unexpected patterns from massive data
Multiple linear regression model
The model requires that the data meet the following requirements: independent, normal distribution, and equal variance model assumptions. When the data does not meet the independent requirements, the model should not be used.
Global Spatial Autocorrelation Analysis
The technique is used to determine the variable of a position in a spatial region has a correlation with the same variable in its vicinity.
Spatial Regression Model
The technique is applicable to the data with spatial correlation. Spatial regression model included spatial lag model (SLM) and spatial error model (SEM).

