Difference between revisions of "Group27 Report"
Xymeng.2017 (talk | contribs) |
Xymeng.2017 (talk | contribs) |
||
| Line 71: | Line 71: | ||
<div style="font-family:Segoe UI Light; font-size:100%; padding: 20px 0px 0px 15px;"> | <div style="font-family:Segoe UI Light; font-size:100%; padding: 20px 0px 0px 15px;"> | ||
…Hosts with multiple listings are more likely to be running a business without a license and not paying taxes, and if they are renting out an entire home or apartment and aren't present, are probably doing so illegally. | …Hosts with multiple listings are more likely to be running a business without a license and not paying taxes, and if they are renting out an entire home or apartment and aren't present, are probably doing so illegally. | ||
| − | + | ||
In addition, in this part, users can check the number and portion of multi-listings in NYC and can also check the top hosts who have more than one listing. For an example, in Queens, top 3 hosts have 18, 15 and 15 listings respectively. | In addition, in this part, users can check the number and portion of multi-listings in NYC and can also check the top hosts who have more than one listing. For an example, in Queens, top 3 hosts have 18, 15 and 15 listings respectively. | ||
However, Inside Airbnb only mention the illegal situation in NYC Airbnb, it does not show any detailed information or analysis about this topic. Therefore, to know more about illegal listings, we find an academic article, The High Cost of Short-Term Rentals in New York City. This article introduces the Airbnb and its critics in New York, it is indicating that, | However, Inside Airbnb only mention the illegal situation in NYC Airbnb, it does not show any detailed information or analysis about this topic. Therefore, to know more about illegal listings, we find an academic article, The High Cost of Short-Term Rentals in New York City. This article introduces the Airbnb and its critics in New York, it is indicating that, | ||
Revision as of 21:41, 13 August 2018
| Overview | Proposal | Poster | Application | Report |
Contents
Introduction
- 1.1 Background
Airbnb is developing fast in recent years, it boasts almost two million listings in 34,000 cities, and according to data from Inside Airbnb, an independent data analysis website. listed about 36000 apartments in New York, which is the one of the biggest markets of Airbnb. However, The New York State Attorney General concluded that 72%of all units used as private short-term rentals on Airbnb during recent years appeared to violate both state and local New York laws. New York’s short-term rental laws, which were last updated in 2010, basically prohibit most apartments (buildings with three or more units) in New York City from being rented out for less than 30 days. Therefore, majority of entire home/apartment listings that you find on Airbnb and other sites for New York City would be considered illegal, especially if you can book them for a period of less than 30 days. Meanwhile, some hosts are purchasing more properties to extend their operating range, we call them commercial operator. Our project mainly has two objects: 1) Explore and visualize how Airbnb operates in New York City 2) Figure out how the New York’s short-term rental laws affect illegal listings and commercial operator in three years.
- 1.2 Motivation
With the developing of Airbnb in New York, an increasing number of hosts have incentive to operate their property as Airbnb for listing short-term rental instead of lending out. In this context, two kinds of host emerged. Commercial Airbnb operators, who have multiple entire-home listings or large portfolios of private rooms, they operate Airbnb as business. Illegal hosts, who might not operate many listings and treat Airbnb as business, they are more willing to gain benefits based on their own property. Looking for quick return is their strategy. Based on these situation, we will explore the relationship among hosts, Airbnb NYC and New York’s short-term rental laws.
Data Preparation
Our dataset is from Inside Airbnb, these three csv files contain summary information and metrics for listings in New York City of 2015 to 2017. We deleted useless variables and summarized the listing which is illegal and the host which is commercial operator by using JMP and R.
Demonstration
- 1. Design Framework
• Maps
To visualize the distribution patterns throughout all the boroughs and neighbourhood in New York City, maps including plot map and choropleth map are introduced to help spatial analysis. The application is empowered by leaflet package developed in HTML environment, and the shape file of both boroughs and neighbourhood are imported to create a hierarchy. At the overview panel, which provides an overall concepts of Airbnb listings in the city wide, the map plots all the listings according to each longitude and latitude, and the shape file enables a polygon boundary to be heighted while mouse hovering, thus the density of listings is obvious and intuitive to be displayed on the map. The colour palette is introduced to quantify the price at the city level, cutting 10 steps in price percentile, both listings density and price distribution are combined to visualize. In this way, the insights related to geospatial patterns are spotted easily - the burst centre is located at the downtown of Manhattan and booming trend sprawls radially. The choropleth maps are served to visualize the severity of illegal and commercial operator among neighbourhood, the reder the more severe situation in this area. The parallel maps help the user to better check the overlapping among all the boroughs and neighbourhood and dive deep to see the patterns.
• Treemap
To create an interactive tree map with hierarchy, we introduce D3tree JS packaged to deployed on our Application. The first level is borough and the second level is neighbourhood, while clicking on specific level, the sub-level zoom out, and the header could bring back to the first level while clicking. To measure and explore the revenue and listing simultaneously, colour is indicated as number of listings and size is represented by revenue, and the tree map provides intuitive view on the both attributes and the comparison within it. The part to whole relationship is available in tree map to trigger dive deep. Leveraged by treemaps, user could explore the revenue contribution, discover average pricing level and compare patterns quantitively among areas.
• Bar Chart
Bar chart is mainly used in our application to give a straight forwards view, since this kind of graph is easy to read and could be improved in multiple ways to cater multiple scenarios. To compare the revenue contribution in desired host type, a bar chart with fill position is implemented since the proportion within each revenue percentile is more suitable to be compared yearly. Meanwhile, the bar chart is easily to show the distribution at very levels, which enables user to compare the same revenue percentile by host type and by year in different boroughs. From the example below, the bar chart shows the illegal host tends to be high revenue operator, and such illegal group seems to grow, compared with the second graph indicating the next year.
- 2. Demonstration
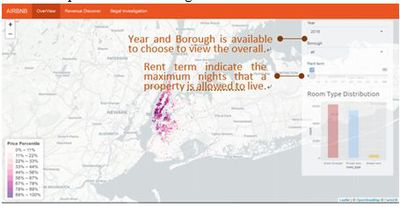
In the tab “Oerview”, user could explore the plot ditribution on borough level, by using several basic filters on the left panel. As dragging the rent term to be bigger, the listings become more, and the room type dirtibution changes accordingly. The room type distribution is varies aomg year and boroughs, and it shows that except Manhattan, most of room in other boroughs is private room rather than entirehome. Echoing to the high price and high density of listings in Manhattan, Manhattan has the highest likelyhood to become suspect areas where illegal host accomodate.
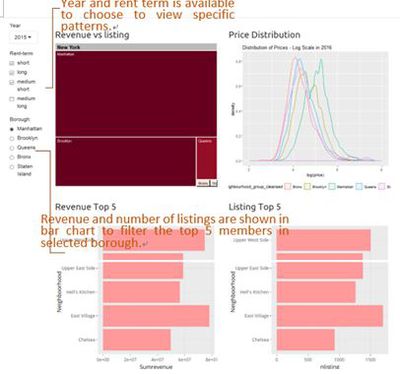
The second tab “Revenue Discover”, provides a revenue contribution structure among boroughs, where we could see the unbalanced and high skewness price distribution. After getting the overview, Manhattan deserved us to do further exploration in terms of revenue. The tree map in year 2015 suggests that the Manhattan with almost equally number of listings compared to Brooklyn yet contribute over half of revenue to New York City Airbnb. This could be explained by the price distribution graph that Manhattan is separated from other boroughs distinguishingly. From the bar chart, we could see that the revenue and number of listings perform highly consistence: the more listings the higher revenue.
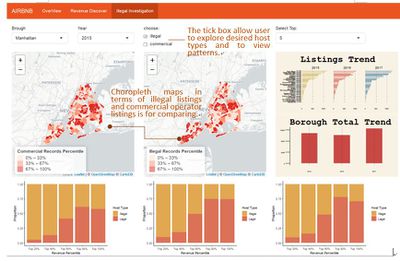
In the tab “Illegal Investigation”, users are provided to self-explore the illegal situation and commercial operational overlapping. Borough Manhattan, 2015, we surprisingly find that it has less neighbourhood with illegal listings compared to Bronx. After the enforcement of law in 2016, which forbidden the illegal short-term rents, the total illegal listings decrease slightly, but it rose higher in year 2017, which should be aware by New York city government. From the simultaneously-changes bar chart, we also see that, with decreasing illegal listings, the proportion of revenue that illegal host contributed decreases. Interestingly, in 2017, when illegal listings increase, the revenue contribution patterns in top 20%-80% does not change too much, while the last 20% revenue percentile allocated more illegal host. The commercial operator then could be conducted to examine that whether the revenue structure changes due to inactive of commercial operator to run the illegal property.
Technical Approach
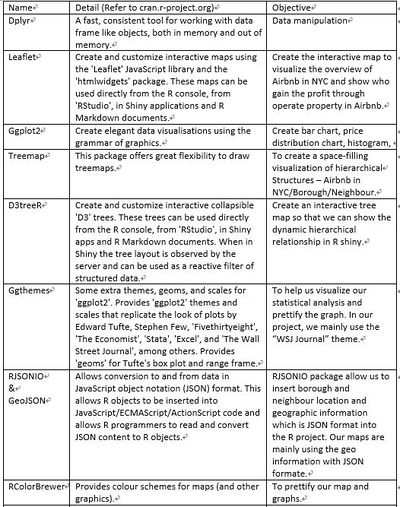
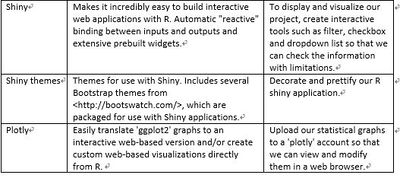
To visualize the overview of Airbnb in NYC and our statistical analysis, we applied several useful R packages:
Visualization
- 1. Geo Spatial Visualization, Inside Airbnb
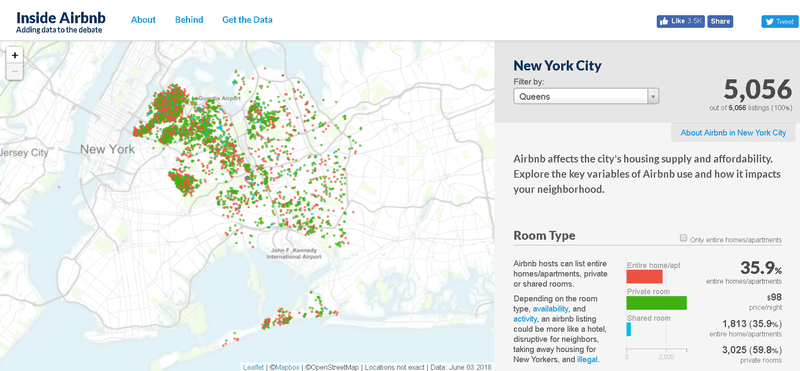
Inside Airbnb is an independent, non-commercial set of tools and data that allows user to explore how Airbnb is being used in cities around the world. Since we want to check the Airbnb operating status in New York City, so we choose the NYC in Inside Airbnb and take Queens as example to check. Below is the Inside Airbnb application:
From the Inside Airbnb, users can easily check the number of listers, room type, activity, availability and listings per host. When users are checking the listings per host part, there are something interesting:
…Hosts with multiple listings are more likely to be running a business without a license and not paying taxes, and if they are renting out an entire home or apartment and aren't present, are probably doing so illegally.
In addition, in this part, users can check the number and portion of multi-listings in NYC and can also check the top hosts who have more than one listing. For an example, in Queens, top 3 hosts have 18, 15 and 15 listings respectively. However, Inside Airbnb only mention the illegal situation in NYC Airbnb, it does not show any detailed information or analysis about this topic. Therefore, to know more about illegal listings, we find an academic article, The High Cost of Short-Term Rentals in New York City. This article introduces the Airbnb and its critics in New York, it is indicating that,
…a large amount of activity on shortterm rental platforms is not “home sharing” as the term is normally understood (occasional shortterm rentals of a family’s primary residence or a room within the primary residence), but rather a new form of de facto hotel.
It also talks about the illegal listing and one new concept: Commercial Operator, which is one kind of the host in Airbnb and control multiple entire-home/apartment listings or large portfolios of private rooms are only 12% of hosts but they earn more than 28% of revenue in New York City.
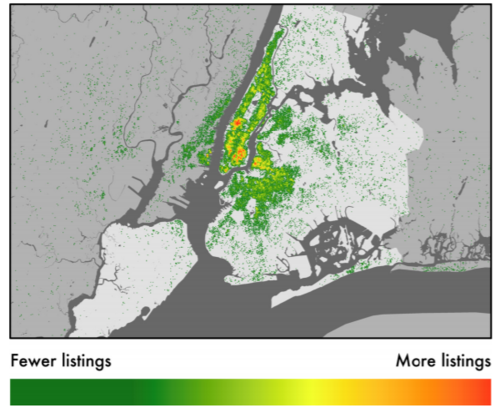
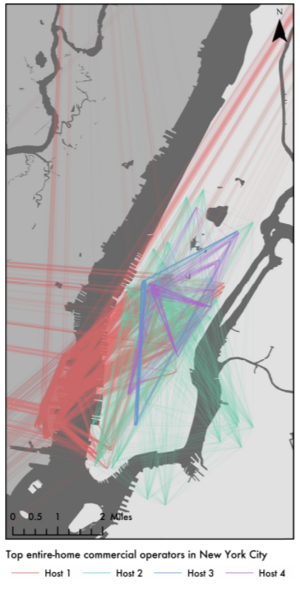
According to this article, the growth in revenue-earning Airbnb listings in 2017 can refer to the map below, it shows where has the highest listing density and where has the fastest revenue growth rate: Based on this information, we can know which borough need to be focus on and has the overall impression of Airbnb in NYC. Next, we were attracted by the part which is about analysing commercial operator. The left figure shows the distributions of the entire home listings for the four commercial operators of entire homes listings in NYC. However, this article only mentioned few about commercial operator and this figure only shows four commercial operators’ listing and relations. To do further analysing and help user to know more about illegal operating and commercial operator of Airbnb in NYC, our research will try to figure out the what is the current and previous situation of illegal phenomenon and commercial operator’s status, find out whether the New York short-term law has any effect on Airbnb in New York, try to summarize the relationships between illegal listings and commercial operators, finally we will visualize all our outcome by applying R shiny to make an interactive application.
- 2. Who Makes Money From Airbnb
According to the visualization, there are some differences between the location of illegal listing and commercial operator. For commercial operators, they are most likely to purchase property in Bronx, Staten island, Queens and Brooklyn; for illegal hosts, their properties are mainly located in Manhattan, Brooklyn and Queens. However, there are still some neighbours of borough are overlapped. For an example, commercial operators and illegal hosts are both likely to appear in Queens. Based on our research, the reason why commercial operator chooses Bronx and Staten island that illegal host doesn’t like is the housing price of these two boroughs are relatively low, especially compare with Manhattan and Queens. However, commercial operator also like Brooklyn and Queens, which are also appreciate by illegal hosts. That is because Brooklyn is a growth borough and have the largest population in NYC, housing price is increasing but still relatively low, these facts indicate that Brooklyn is a good choice for investing. In addition, Queens is the second wealthiest borough which is only fall behind Manhattan, it also contains a great number of tourist attractions and facilities such as Flushing-China town, Flushing Meadows–Corona Park and Kennedy International Airport, these advantages make Queens become another good place for investing. For illegal hosts, the allocation is even spread relatively, since they prefer making quick money instead of long-term targeted investment. Besides, according to the research, some of illegal hosts are lending out during business trip and vocation, they just don’t want to let their property be idle. However, with the applying of New York’s short-term rental laws, the phenomenon of operating Airbnb illegally is decreasing in recent years. In 2016,
… New York State has just passed what is called an “Anti-Airbnb” law through the Senate and the Assembly. As of this month, June 2016, it is awaiting the Governor’s signature for it to pass and become state law.
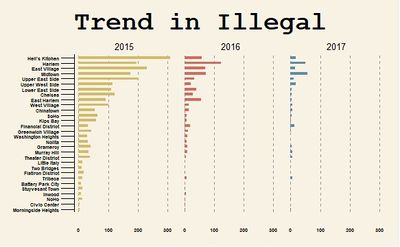
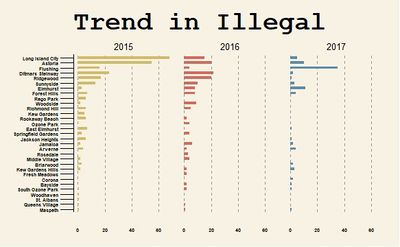
Take Manhattan and Queens as example, according to the chart, in 2015, the quantities of illegal listings are high, after one year, the number drop down nearly 60%; in 2017, the illegal listings are nearly disappeared in most neighbors. However, there is an exception. The illegal listings number of Flushing, which is one of the neighbors of Queens, was decreasing in 2016, but increasing a lot in 2017. The reason of this phenomenon is that Flushing is one of the famous scenic area in NYC; it also near JFK, which is the biggest airport in New York. There are millions of visitors from all over the world come to NYC through JFK, therefore, the greater profits drive a huge number of hosts over the edge, break laws for money.
In addition, with the implementation of the law, not only the number of illegal people has decreased drastically, but also the number of commercial operators has changed. In the 2015-2016 New York Airbnb activities, the number of commercial operators took a significant proportion of Top 20% of New York's Airbnb revenue, but by 2017, we could hardly see them. This shows that the Commercial operator and the illegal listings partially overlap, so we conclude that Commercial operator itself is not illegal, but some of them is engaged in illegal business.
Conclusion and Insight
In conclusion to the insights discovered:
- Airbnb is flouring in New York City, especially popular in Manhattan and Brooklyn with high price and tight booking schedule.
- Manhattan contributes over half of whole revenue, larger than aggregated revenue of remining borough.
- Deriving by revenue, both commercial operators and illegal hosts are preferring to operate their Airbnb property in Brooklyn and Queens which can better capture market needs.
- With the practice with New York’s short-term rental laws, the illegal phenomenon was disappearing. However, some arbitragers are still seeking illegal operating in some popular district like Queens and Brooklyn.
Discussion
On 12 August 2018, we had a great opportunity to showcase our application to our classmates and some invited guests in a presentation event. We do receive many valuable comments about our work. Our audience give us a lot implementing suggestions, especially our Professor and advisor to the project, guide our team to change and modify our application in terms of changing the graph type, add some label words and other details. And some classmates suggest us to add more variables into analysis the revenue to make the conclusion more convincing, for the poster we could give more graphs to interpret instead of long paragraph words.
Future Work
Given time constraints, the current application still has room to improve. For our Airbnb overview analysis, we may add population, housing price and the housing stock in different borough into consideration since these variables are important indicator when we analyse the overall Airbnb listings. otherwise, it would a bit absolutely to get our conclusions. And for our revenue algorithm, we can improve its accuracy by taking the probability, the overall score, the number of reviews as factors to calculate.
For the technical part, the application can be enhanced to allow more multiple view interactive visualization for users to easy understand instead of current plot and line chart representation. For the illegal investigation part, the listing tree should be replacing into clear bar chart, let user to select the top 5 or 10 areas listings.
Installation Guide
At the point of the project, R Studio version 1.1.383 was used to create the application. 1) Install R Studio version 1.1.383 from: https://www.rstudio.com/ 2) Open the installed R Studio application, and under the top menu, select Tools > Install Packages... Type in the following package names under the "Packages" field and click 'Install'. shiny, DT, tidyverse, Dplyr, ggplot2, RISONIO&GEOISON, Shiny themes and Plotly. 3) After the packages have finished installing, open the project files and click on "Run App".
User Guide
This section details the actual steps in using the application and see the visualization results. below is the main page of our application, and there are three separate interfaces of our application:
- [1] From the first page, we can explore the overview activity in New York’s Airbnb, on the right-hand side panel, users can select a year range from 2015 to 2017 to see different period’s Airbnb housing price, the ‘Borough’ is for user to filter the five main borough in New York to see the difference in areas. Since the Rent term is an important factor influence the house price, so from zooming the Rent term button we can see the difference of short-term rent and long-term rent of each areas. And the bar chart ‘Room Type Distribution’ would change based on the selection above. It will show you the room type distribution.
- [2] Move on the second interface, this section is for user to explore the revenue of Airbnb actives, the left side panel is to filter different year with different rent terms. Since the rent terms is an important factor influence the housing price. The tree map ’Revenue vs Listing’ can be click on borough to see more specific area in this district in terms of revenue and listing result. The ‘Price distribution’ would let us the price difference in different borough. And this two bar chart show us the top 5 revenue and listing area separately based on users’ selection of borough.
- [3] The third interface is for exploring the illegal investigation, Users can also filter out the sub-graphs by clicking on their respective drop-down boxes and checkboxes at the top. Based on the selection, we can see the commercial revenue percentile and illegal revenue percentile distribution in New York city, therefore we can see the differences and compare the illegal investigation in different borough.
Acknowledgements
The authors wish to thank Ting Seong KAM, professor of Visual analytics in School of Information Systems, Singapore Management University for his ongoing support.
References
[1]Airbnb. 2014. Airbnb and Housing. Available online at Last accessed November 3, 2017.
[2]Litten, K. 2016. Neighborhood ‘Mourners’ Want New Orleans Short-Term Rentals Regulated. The Times-Picayune. Available online at Last accessed July 4, 2017.
[3]Lee, D. 2016. How Airbnb Short-Term Rentals Exacerbate Los Angeles’s Affordable Housing Crisis: Analysis and Policy Recommendations. Harvard Law & Policy Review 10: 229-253.
[4]New York Communities for Change and Real Affordability for All. (2015). Airbnb in NYC: Housing Report 2015. Policy report
[5]Barron, K., Kung, E., & Proserpio, D. (2017). The Sharing Economy and Housing Affordability: Evidence from Airbnb. Retrieved from https://papers.ssrn.com/sol3/papers.cfm?abstract_id=3006832
