Difference between revisions of "Group06 Report"
Ydzhang.2017 (talk | contribs) |
Ydzhang.2017 (talk | contribs) |
||
| (7 intermediate revisions by 2 users not shown) | |||
| Line 45: | Line 45: | ||
===Customer Segmentation=== | ===Customer Segmentation=== | ||
| + | |||
| + | ====RFM exploratory analysis==== | ||
| + | |||
| + | The recency, frequency and monetary measures of each customer are the raw materials required for all subsequent analysis. Therefore, it is essential for the users to plot a histogram to study to distribution to understand whether there are outliers or distributions that are outside the norm. This part of the analysis, using “plotly”, has been done to uncover these insights. | ||
| + | One of aims of this application is to allow users to perform customer segmentation visually and interactively. An intuitive methodology RFM is applied in this project to strengthen the result of customer segmentation. RFM facilitates the consumer analytics process in three different dimensions: recency (how recently the customer purchased), frequency (how often customer purchase) and monetary (how much customers spend). | ||
| + | |||
| + | ====K-means approach==== | ||
One of aims of this application is to allow users to perform customer segmentation visually and interactively. An intuitive methodology RFM is applied in this project to strengthen the result of customer segmentation. RFM facilitates the consumer analytics process in three different dimensions: recency (how recently the customer purchased), frequency (how often customer purchase) and monetary (how much customers spend). | One of aims of this application is to allow users to perform customer segmentation visually and interactively. An intuitive methodology RFM is applied in this project to strengthen the result of customer segmentation. RFM facilitates the consumer analytics process in three different dimensions: recency (how recently the customer purchased), frequency (how often customer purchase) and monetary (how much customers spend). | ||
K-means clustering algorithm uses RFM variables to form consumers into clusters. With understanding of the characteristics of different consumers group, business operator can make customized strategy to target different consumer groups. | K-means clustering algorithm uses RFM variables to form consumers into clusters. With understanding of the characteristics of different consumers group, business operator can make customized strategy to target different consumer groups. | ||
| + | |||
| + | ====Hierarchical clustering approach==== | ||
| + | Another popular unsupervised learning method implemented in this application is Hierarchical clustering. Compared to K-means, hierarchical clustering does not require priori information about the number of clusters required and it can give best result in some cases. | ||
| + | |||
| + | ====Latent class analysis approach==== | ||
| + | |||
| + | To reduce the impact of outliers and to ensure that the customers are distributed evenly across the three measures, we have ranked all the customers based on the three measures to conduct latent class analysis. We feel that users would want this feature to understand whether there are hidden clusters based on this popular algorithm. | ||
===Natural Language Processing=== | ===Natural Language Processing=== | ||
| Line 118: | Line 132: | ||
===Customer Segmentation=== | ===Customer Segmentation=== | ||
| + | |||
| + | ====RFM exploratory analysis==== | ||
| + | |||
| + | Descriptive analytics, using frequency charts, can help the user understand the presence of any anomalies within the data set. Therefore, we have created a distribution chart that gives the user the ability to see this. They will also be able to change the level of details required by changing the slider below each individual chart (i.e. recency, frequency and monetary measures with bin sizes). A higher number signifies more detail and vice-versa. | ||
| + | [[File:RFM exploratory analysis.png|center|800px]] | ||
====K-means approach==== | ====K-means approach==== | ||
| Line 132: | Line 151: | ||
[[File:Customer segmentation2.JPG|center|800px]] | [[File:Customer segmentation2.JPG|center|800px]] | ||
| + | |||
| + | |||
| + | ====Hierarchical clustering approach==== | ||
| + | In this section, user can choose the way of normalization in the input box. The clustering result will be shown in the right panel of the page. The data contains over four thousand data instances. For the effectiveness of visualization on the web page, 30 data instances will be randomly chosen for data visualization. | ||
| + | [[File:Hclust group6.png|center|700px]] | ||
====Latent class analysis approach==== | ====Latent class analysis approach==== | ||
| + | |||
| + | Latent class analysis is a method of clustering data points based on multivariate categorical variables. For this portion of the analysis, we ranked the recency, monetary and frequency measures into five ranks for each measure. Next, we then applied latent class analysis on these ranks. As mentioned, we used the poLCA library to perform this portion of the exercise. | ||
| + | |||
| + | |||
| + | [[File:LCA approach.png|center|800px]] | ||
===Natural Language Processing=== | ===Natural Language Processing=== | ||
Latest revision as of 21:35, 13 August 2018
| Overview | Proposal | Poster | Application | Report | All Projects |
Contents
Introduction
An e-commerce company in the United Kingdom has provided their transaction data from 1 December 2010 to 9 December 2011. This company mainly has wholesalers as its customers. Based on the data provided, the company’s client portfolio is mainly based in the United Kingdom. Within the data set, the key variables given are: (i) invoice number; (ii) stock code; (iii) description; (iv) quantity; (v) invoice date; (vi) unit price; (vii) customer identification number; and (viii) country. Being a primarily sales driven company, the key objective should be to maximize the revenue of the company. To achieve this, we will adopt a three-pronged approach:
(a) Identify cross-sell opportunities through customer similarities.
(b) Clustering of high value customers to target.
(c) Reviewing product descriptions to understand the product descriptions that sell well.
Motivation and Objective
On the market, there are various customer intelligence platforms available: “DataSift”, “SAS Customer Intelligence”, “Accenture Insights Platform”, etc. However, none of them are offer an integrated bespoke solution for our data on hand. Our motivation is to build an entirely bespoke application that would allow the company to fully analyse their data right at the onset.
Cosine Similarity
This part of the application aims to find similarities between customers. Given that there are 3,866 products, we have decided to utilize the customers’ historical patterns in purchasing products to measure similarities between customers. To do this, we have created a matrix comprising the customers (columns) and products (rows). The values within depict the amount of the products these customers bought. Through the similarity of product purchases, clusters of customers can then be formed. Depending on the strength of this similarity between customers, a network diagram can then be drawn to visualize the customers. This will help to provide a meaningful way of grouping customers together so that different marketing campaigns and client relationship officers can be allocated to them.
Customer Segmentation
RFM exploratory analysis
The recency, frequency and monetary measures of each customer are the raw materials required for all subsequent analysis. Therefore, it is essential for the users to plot a histogram to study to distribution to understand whether there are outliers or distributions that are outside the norm. This part of the analysis, using “plotly”, has been done to uncover these insights. One of aims of this application is to allow users to perform customer segmentation visually and interactively. An intuitive methodology RFM is applied in this project to strengthen the result of customer segmentation. RFM facilitates the consumer analytics process in three different dimensions: recency (how recently the customer purchased), frequency (how often customer purchase) and monetary (how much customers spend).
K-means approach
One of aims of this application is to allow users to perform customer segmentation visually and interactively. An intuitive methodology RFM is applied in this project to strengthen the result of customer segmentation. RFM facilitates the consumer analytics process in three different dimensions: recency (how recently the customer purchased), frequency (how often customer purchase) and monetary (how much customers spend).
K-means clustering algorithm uses RFM variables to form consumers into clusters. With understanding of the characteristics of different consumers group, business operator can make customized strategy to target different consumer groups.
Hierarchical clustering approach
Another popular unsupervised learning method implemented in this application is Hierarchical clustering. Compared to K-means, hierarchical clustering does not require priori information about the number of clusters required and it can give best result in some cases.
Latent class analysis approach
To reduce the impact of outliers and to ensure that the customers are distributed evenly across the three measures, we have ranked all the customers based on the three measures to conduct latent class analysis. We feel that users would want this feature to understand whether there are hidden clusters based on this popular algorithm.
Natural Language Processing
It is very important for management to understand customer preferences for different products, Natural Language Processing is conducted to explore the popularity of products. By understanding what are the most and least popular products and the properties of the popular products, the management will be able to make smarter decisions towards the customer’s preference, thus improve the revenues.
We use the column “descriptions” and “quantity” in the data set to conduct the Natural Language Processing. The description gives the product name, for example “WHITE METAL LANTERN”. The quantity gives the number of the products ordered.
R Programming and usage of R Packages
We have developed the application in Shiny, an open source R package, which provides a powerful web framework for building web applications. For performing data cleaning and building the visualizations, we have experimented with different R packages and would like to introduce some of the key packages that we found useful in this paper.
Reducing Development Time on Shiny
As all the team members wanted to contribute and reduce development time on the application, we adopted two initiatives to ensure that everything is smooth sailing.
Git Server
The team started a Git repository on GitHub to manage the development process. This is key to ensure that all the code developments do not conflict with the other sections. At the end of each development cycle, the team was then able to put the code together with less hassle while ensuring that the application had minimal bugs.
R Shiny Folder Structure
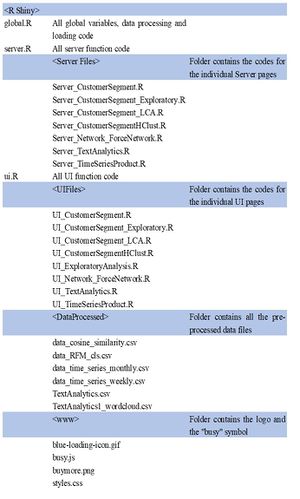
Due to the number of people working on the code, it is essential to ensure that the code is fully readable. Therefore, we adopted the following folder structure to ensure that each respective sections of code are within a separate R script:
Cosine similarity
coop: There are 4,370 customers and 3,866 products. With a 4370 by 3866 matrix, the processing time for coming up with the cosine similarity matrix with this dataset will be lengthy. However, with the “coop” R package, the process was relatively quicker, as it was operating on a matrix with native functions.
tidyr: The initial data set is in a long format. To make it into a wide format table instead (i.e. by spreading the key-value pairs across multiple columns), we applied the “spread” function from the “tidyr” package. Without this package, it would be difficult to ensure the consistent data formats between tables.
data.table: A key requirement to utilize the “coop” package is that the data set needs to be presented in the form of a matrix. To do this, we converted the data set into a data table. Subsequently, we converted this data table into a matrix with the “as.matrix” function.
One thing to note is that the values within the matrix needs to be of a consistent data type. This would mean that the row names need to be indicated as the actual row name and not a variable by itself.
Customer Segmentation
mclust: To perform k-means clustering, the application calls “kmeans” functions from “mclust” package. The function returns clustering labels.
plotly: To provide RFM analysis in an interactive manner, “plotly” package is used here for data visualization. This application applies three variables in RFM methodology for clustering. The clustering result is plotted in a 3D space. “Plotly: allows user to rotate the graph in 3 different dimensions and “Plotly” also allows developer to configure the tooltip for data points.
Natural Language Processing
dplyr: There are some missing and dirty data in the column “Description”. Such as ‘? sold as sets?', '?? missing' and etc. Data cleaning is conducted using package “dplyr” before the natural language processing. “dplyr” is a powerful R-package for data manipulation. It can transform and summarize tabular data with operations such as filtering for rows, selecting specific columns, summarizing data and etc. The missing and dirty data is removed with function “filter”.
To find out the popularity of the product, the column “quantity” also needs to be taken into consideration. The product is multiplied by its quantity to find the total number for each product. The function “select”, “group_by” and “summarise” are used to find the total number of quantity of each product.
tm: “tm” package is used to perform text mining and pre-processing steps for text analysis. The main structure for managing documents in tm is called a Corpus, which represents a collection of text documents. “Vcorpus” function is used to represent the data as a collection of text documents. The corpus is stored in the variable “docs”. Pre-processing transformations are done via the tm_map() function which applies a function to all elements of the corpus. The pre-processing transformations include removing of punctuation, removing of numbers, converting all letters to lower case, removing of stopwords and removing of stripWhitespace.
Next, DocumentTermMatrix() function is used to convert each row of the matrix a document vector, with one column for every term in the entire corpus. Some documents may not contain a given term, so the matrix is sparse. The value in each cell of the matrix is the term frequency.Function removeSparseTerms() is used to remove all terms whose sparsity is greater than the threshold value.
wordcloud2: The word cloud is implemented with “wordcloud2” library. The package provides an HTML5 interface to wordcloud for data visualization.
topicmodels: Latent Dirichlet allocation (LDA) is used to conduct the topic modelling with library “topicmodels”, The per-topic-per-word probabilities beta is extracted from the model by tidy() function.
Demonstration
Cosine similarity
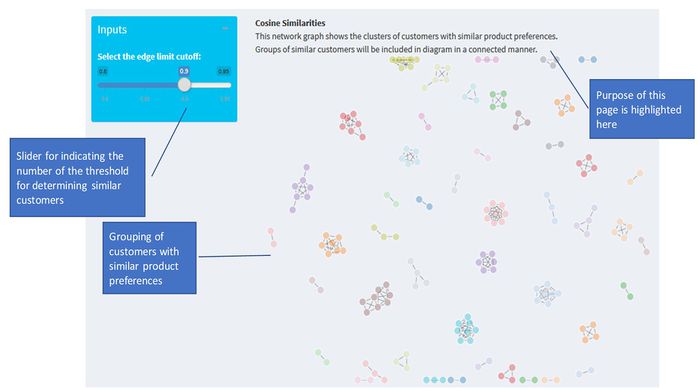
With 4,370 customers, it is difficult to come up with a sales strategy for each customer. However, through the use of the cosine similarity algorithm, these customers can be segregated into different groupings based on their purchase history. Through this segregation, different marketing campaigns or product promotions can be made to them.
For this visualization, the slider provides the user with the means to reduce or increase the number of customers in the groupings. A high number signifies that similarities below the number will be removed from the visualization. This will help to reduce information paralysis.
Customer Segmentation
RFM exploratory analysis
Descriptive analytics, using frequency charts, can help the user understand the presence of any anomalies within the data set. Therefore, we have created a distribution chart that gives the user the ability to see this. They will also be able to change the level of details required by changing the slider below each individual chart (i.e. recency, frequency and monetary measures with bin sizes). A higher number signifies more detail and vice-versa.
K-means approach
Clustering with RFM methodology forms clusters with three dimensions. In the application, the clustering result is visualized in the 3D scatter plot. The different color represents different clusters.
User can use mouse wheel to zoom in/ zoom out and rotate the graph. For clustering parameters, application allows user to key in the number of clusters and choose different normalization methods. Besides that, user can also click the legend to show or hide data points from the cluster.
In lower part of this tab, the application uses box plots to visualize the comparison of clusters. The same cluster is represented with the same color as the 3D scatter plot as the upper part of this tab.
Hierarchical clustering approach
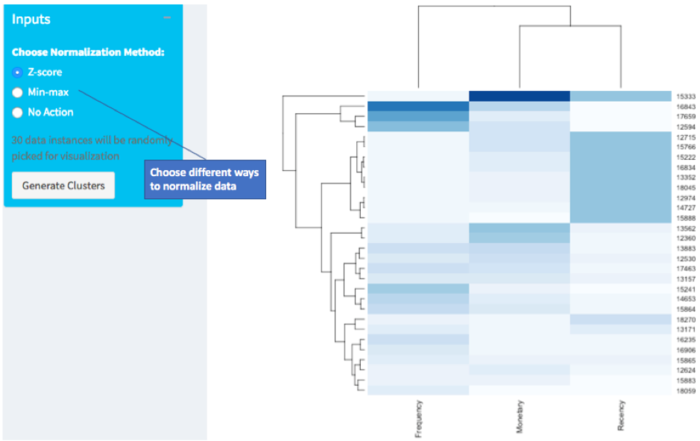
In this section, user can choose the way of normalization in the input box. The clustering result will be shown in the right panel of the page. The data contains over four thousand data instances. For the effectiveness of visualization on the web page, 30 data instances will be randomly chosen for data visualization.
Latent class analysis approach
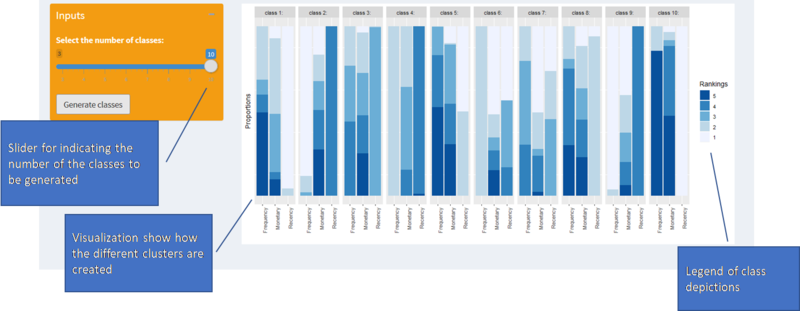
Latent class analysis is a method of clustering data points based on multivariate categorical variables. For this portion of the analysis, we ranked the recency, monetary and frequency measures into five ranks for each measure. Next, we then applied latent class analysis on these ranks. As mentioned, we used the poLCA library to perform this portion of the exercise.
Natural Language Processing
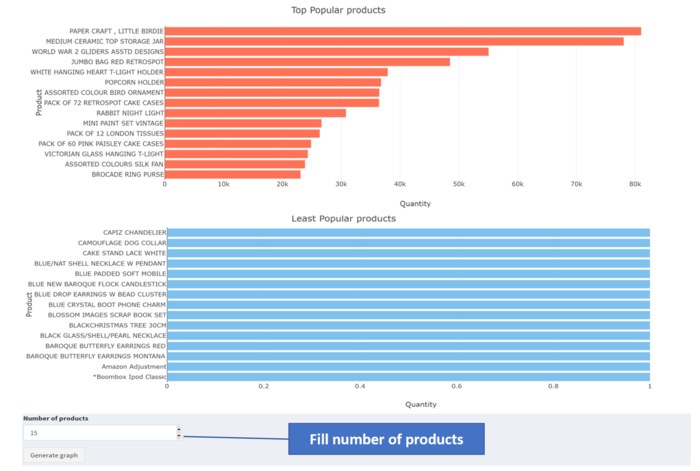
The Natural Language Processing visualization is designed with the “Text Analytics” tab. The product popularity is visualized in the first sub-tab. User can select the number of most popular and least popular products to show. The product popularity ranking shows that the top three best seller products are “Paper Craft”, “Medium Ceramic Top Storage Jar” and “Word War 2 Gliders Asstd Designs”.
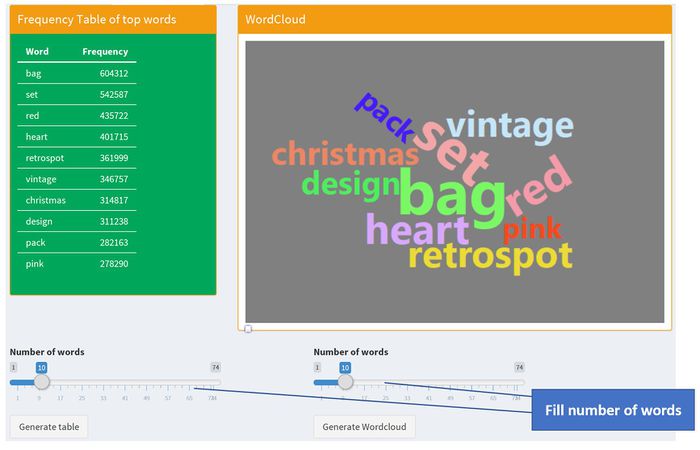
The second sub-tab shows the words popularity visualized by frequency table and word clouds. User can select the number of words to show. The top words ranking shows the top three popular words are “bag”, “set” and “red”. It indicates that customer like to buy bags, value/gift sets. The most popular product color is red.
Future works
As we are developing an application, the introduction of more features and capabilities to the application will be important for its future development.
- Cosine similarity algorithms have been applied to the customers to understand customer similarities and how customers can be grouped under different customer relationship managers. Moving forward, we could also apply the same algorithm to the products to understand product groupings based on the similarity of the group of customers purchasing them.
- For the RFM model, moving forward,we could use other methodogies apart from RFM, to differentiate among clusters.
- Topic modelling within the natural language processing is currently not within the application. As such, we would incorporate the ability to allow users to select clusters and the number words to generate topics. This would allow users to generate topics of their own to understand the product categories available.
Acknowledgements
The authors wish to thank Professor Kam Tin Seong for his guidance and challenges offered to the team throughout the term.
References
[1] Hadley Wickham, Romain François, Lionel Henry and Kirill Müller (2018). dplyr: A Grammar of Data Manipulation. R package version 0.7.6. https://CRAN.R-project.org/package=dplyr
[2] Hadley Wickham and Lionel Henry (2018). tidyr: Easily Tidy Data with 'spread()' and 'gather()' Functions. R package version 0.8.1. https://CRAN.R-project.org/package=tidyr
[3] H. Wickham. ggplot2: Elegant Graphics for Data Analysis. Springer-Verlag New York, 2016.
[4] Carson Sievert (2018) plotly for R. https://plotly-book.cpsievert.me
[5] Hadley Wickham (2017). tidyverse: Easily Install and Load the 'Tidyverse'. R package version 1.2.1.https://CRAN.R-project.org/package=tidyverse
[6] Garrett Grolemund, Hadley Wickham (2011). Dates and Times Made Easy with lubridate. Journal of Statistical Software, 40(3), 1-25. URL http://www.jstatsoft.org/v40/i03/.
[7] Edwin Thoen (2018). padr: Quickly Get Datetime Data Ready for Analysis. R package version 0.4.1. https://CRAN.R-project.org/package=padr
[8] Schmidt D (2016). _Algorithms and Benchmarks for the coop Package_. R Vignette, <URL:https://cran.r-project.org/package=coop>.
[9] Matt Dowle and Arun Srinivasan (2017). data.table: Extension of `data.frame`. R package version 1.10.4-3. https://CRAN.R-project.org/package=data.table
[10] Alexis Sarda-Espinosa (2018). dtwclust: Time Series Clustering Along with Optimizations for the Dynamic Time Warping Distance. R package version 5.5.0. https://CRAN.R-project.org/package=dtwclust

