Difference between revisions of "Group01 Report"
Yc.lim.2016 (talk | contribs) |
Yc.lim.2016 (talk | contribs) |
||
| Line 94: | Line 94: | ||
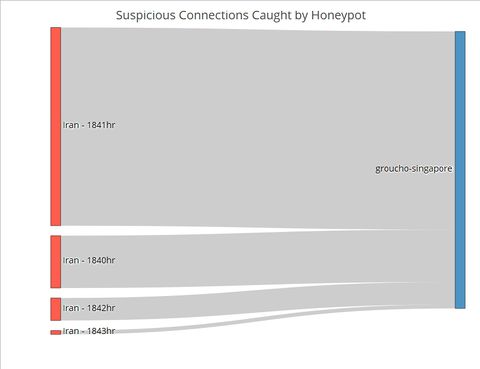
In our dataset, there is a clear-cut attempt from Iran on 6th May 2013. This attempt was detected and caught by Singapore’s AWS Honeypot. The Sankey chart for this Iranian effort (Figure 1) shows both the exact timing and quantity of the connections. There was a huge surge of 405 connections at 18:41 hours, with 107 connections in the minute before.<br><br> | In our dataset, there is a clear-cut attempt from Iran on 6th May 2013. This attempt was detected and caught by Singapore’s AWS Honeypot. The Sankey chart for this Iranian effort (Figure 1) shows both the exact timing and quantity of the connections. There was a huge surge of 405 connections at 18:41 hours, with 107 connections in the minute before.<br><br> | ||
[[File:1718T3_IRAN_Sankey_Singapore_Honeypot.jpeg|480px|centre]] <br><br> | [[File:1718T3_IRAN_Sankey_Singapore_Honeypot.jpeg|480px|centre]] <br><br> | ||
| + | <div style="text-align: center;"> | ||
<small>Fig. 1. The number of connections from Iran by the minute on 6 May<br><br></small> | <small>Fig. 1. The number of connections from Iran by the minute on 6 May<br><br></small> | ||
| + | </div> | ||
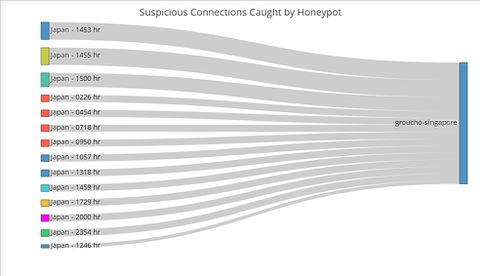
Contrast the Sankey chart of connections from Iran to that of connections from Japan (Figure 2). While Japanese connections were more frequent (i.e. occurring at more timings across the day) than Iranian ones, there were less of them for each given minute. This stark contrast is further proof that the Iranian connections were indeed carried out as an attack.<br><br> | Contrast the Sankey chart of connections from Iran to that of connections from Japan (Figure 2). While Japanese connections were more frequent (i.e. occurring at more timings across the day) than Iranian ones, there were less of them for each given minute. This stark contrast is further proof that the Iranian connections were indeed carried out as an attack.<br><br> | ||
[[File:1718T3_JAPAN_Sankey_Singapore_Honeypot.jpeg|480px|centre]] <br><br> | [[File:1718T3_JAPAN_Sankey_Singapore_Honeypot.jpeg|480px|centre]] <br><br> | ||
| + | <div style="text-align: center;"> | ||
<small>Fig. 2. The number of connections from Japan by the minute on 6 May</small> | <small>Fig. 2. The number of connections from Japan by the minute on 6 May</small> | ||
</div> | </div> | ||
| − | |||
<!--Design Framework and Visualization Methodologies--> | <!--Design Framework and Visualization Methodologies--> | ||
Revision as of 15:22, 13 August 2018
LINK TO PROJECT GROUPS:
Please Click Here -> [1]
Cybersecurity
|
|
|
|
|
Contents
Introduction
PUT YOUR CONTENT HERE |
Objective and Motivations
PUT YOUR CONTENT HERE |
Previous Works
PUT YOUR CONTENT HERE |
Dataset and Data Preparation
PUT YOUR CONTENT HERE |
Design Framework and Visualization Methodologies
In designing our R Shiny application to visualise suspicious Honeypot activity, we consulted Stephen Few’s whitepaper on the common pitfalls of dashboard design[1]. We found that our initial wireframe suffered from some of the pitfalls, namely displaying excessive detail, arranging the data poorly and misusing colour. Thus, we went back to the drawing board and arrived at a new three-tiered design that avoided those pitfalls. Control ChartPUT HERE Network ChartPUT HERE Sankey ChartTo this point, the user has identified the day which has significant suspicious activities using the control chart, and the countries where the activities originate using the network graphs. The final step of this visualization journey is to find out the exact timing of the activities, which will allow cybersecurity experts to perform further investigations and take targeted measures. For instance, the experts could explore the data to see if the attackers were targeting certain TCP or UDP ports which by extension would suggest that certain applications running at those timings contained exploitable loopholes or backdoors. Fig. 1. The number of connections from Iran by the minute on 6 May Contrast the Sankey chart of connections from Iran to that of connections from Japan (Figure 2). While Japanese connections were more frequent (i.e. occurring at more timings across the day) than Iranian ones, there were less of them for each given minute. This stark contrast is further proof that the Iranian connections were indeed carried out as an attack. Fig. 2. The number of connections from Japan by the minute on 6 May
Insights and Implications
Limitation and Future Work
Conclusion
References
|


