Difference between revisions of "Group11 Proposal"
| (9 intermediate revisions by 2 users not shown) | |||
| Line 4: | Line 4: | ||
<!--MAIN MENU --> | <!--MAIN MENU --> | ||
{|style="background-color:#1B338F;" width="100%" cellspacing="0" cellpadding="0" valign="top" border="3" | | {|style="background-color:#1B338F;" width="100%" cellspacing="0" cellpadding="0" valign="top" border="3" | | ||
| − | | style="font-family: Verdana; font-size:100%; solid #000000; background:#000024; text-align:center;" width=" | + | | style="font-family: Verdana; font-size:100%; solid #000000; background:#000024; text-align:center;" width="10%"| |
; | ; | ||
[[Group11_Overview| <font color="#F9C124"><b>OVERVIEW</b></font>]] | [[Group11_Overview| <font color="#F9C124"><b>OVERVIEW</b></font>]] | ||
| − | | style="font-family:'Droid Sans', sans-serif;; font-size:100%; solid: #FFFF00; background:#000024; text-align:center;" width=" | + | | style="font-family:'Droid Sans', sans-serif;; font-size:100%; solid: #FFFF00; background:#000024; text-align:center;" width="10%" | |
; | ; | ||
[[Group11_Proposal|<font color="#F9C124"><b>PROPOSAL</b></font>]] | [[Group11_Proposal|<font color="#F9C124"><b>PROPOSAL</b></font>]] | ||
| − | | style="font-family:'Droid Sans', sans-serif;; font-size:100%; solid :#FFFF00; background:#000024; text-align:center;" width=" | + | | style="font-family:'Droid Sans', sans-serif;; font-size:100%; solid :#FFFF00; background:#000024; text-align:center;" width="10%" | |
; | ; | ||
[[Group11_Poster| <font color="#F9C124"><b>POSTER</b></font>]] | [[Group11_Poster| <font color="#F9C124"><b>POSTER</b></font>]] | ||
| − | | style="font-family:'Droid Sans', sans-serif;; font-size:100%; solid :#FFFF00; background:#000024; text-align:center;" width=" | + | | style="font-family:'Droid Sans', sans-serif;; font-size:100%; solid :#FFFF00; background:#000024; text-align:center;" width="10%" | |
; | ; | ||
[[Group11_Application| <font color="#F9C124"><b>APPLICATION</b></font>]] | [[Group11_Application| <font color="#F9C124"><b>APPLICATION</b></font>]] | ||
| − | | style="font-family:'Droid Sans', sans-serif;; font-size:100%; solid : #FFFF00; background:#000024;text-align:center;" width=" | + | | style="font-family:'Droid Sans', sans-serif;; font-size:100%; solid : #FFFF00; background:#000024;text-align:center;" width="10%" | |
; | ; | ||
[[Group11_Report| <font color="#F9C124"><b>REPORT</b></font>]] | [[Group11_Report| <font color="#F9C124"><b>REPORT</b></font>]] | ||
| + | | style="font-family:'Droid Sans', sans-serif;; font-size:100%; solid : #FFFF00; background:#000024;text-align:center;" width="10%" | | ||
| + | ; | ||
| + | [[Project_Groups| <font color="#F9C124"><b>BACK TO HOME</b></font>]] | ||
| + | |||
|} | |} | ||
| + | |||
| Line 41: | Line 46: | ||
[[File:Agg crime.png|400px]] | [[File:Agg crime.png|400px]] | ||
<br> | <br> | ||
| − | Through our analysis, we hope to provide a comprehensive overview of crime statistics in these | + | Each borough consists of Police Stations which have a demarcated area in the city called Precincts. There are a total of 77 Precincts in NYC. Through our analysis, we hope to provide a comprehensive overview of crime statistics in these 77 Precincts of New York City and illustrate the power of using this data for crime statistics and forecasts for the efficient allocation of Police personnel and resources across Precincts. |
</p> | </p> | ||
| + | |||
==Motivation== | ==Motivation== | ||
| − | <p>Crime | + | <p>Crime is an act punishable by law that has been timeless is prevalent in every society. Crime activities are recorded for crime analysis which involves systematic analysis for identifying and analyzing patterns and trends in crime and disorder. In January 2017, The Public Advocate for the City of New York published an open letter to the Commissioner of the New York Police Department (NYPD) addressing the issue of high crime rates in certain neighborhoods of NYC.It points out that the precincts associated with these neighborhoods have shortage of detectives as compared to precincts in neighborhoods with fewer crimes. It talks about an ongoing issue of poor resource allocation and deployment of police personnel with respect to crime numbers. For our crime analysis, we have used the NYPD crime data for the which spans crimes records across the 5 boroughs of NYC which consists of 77 precincts. We aim to provide a visual tool to observe the crime patterns with respect to time and location. On doing this, the rate of crime can be analyzed and hence forecasted for law enforcement agencies can estimate the right number of resources to deploy. </p> |
==Key Objectives== | ==Key Objectives== | ||
| Line 50: | Line 56: | ||
<p> | <p> | ||
1. <b>Provide a visual representation of crime statistics</b>: | 1. <b>Provide a visual representation of crime statistics</b>: | ||
| − | Through our visual dashboard, we can provide a one stop view for the exploratory analysis of crime stats. The user will be able to view, compare and analyse crime stats based on type of crime, location, time of day | + | Through our visual dashboard, we can provide a one stop view for the exploratory analysis of crime stats. The user will be able to view, compare and analyse crime stats based on type of crime, location, vicinity of crimes and time of day.<br><br> |
| − | < | + | |
| − | < | + | 2. <b>Forecast of crime numbers at Precinct Level</b>: |
| − | + | We aim to forecast and visualize the number of crimes and calculate crime rates at a Precinct level.<br><br> | |
| − | + | ||
| + | 3. <b>Crime Rate Calculation</b>: | ||
| + | Using Crime numbers and population data, we will be calculating the crime rates across each precinct.<br><br> | ||
</p> | </p> | ||
| Line 70: | Line 78: | ||
</p> | </p> | ||
| − | <p><b>3 | + | <p><b>3. New York Sector Data</b><br> |
| − | |||
| − | |||
| − | |||
| − | |||
| − | |||
| − | |||
| − | |||
| − | |||
| − | |||
| − | |||
| − | |||
| − | |||
| − | |||
This serves as an additional dataset to identify the patrol areas and boundaries of the individual precincts across the five boroughs.<br> | This serves as an additional dataset to identify the patrol areas and boundaries of the individual precincts across the five boroughs.<br> | ||
<br> | <br> | ||
| Line 109: | Line 104: | ||
2. NYPD Precinct: https://www1.nyc.gov/site/nypd/bureaus/patrol/precincts-landing.page <br> | 2. NYPD Precinct: https://www1.nyc.gov/site/nypd/bureaus/patrol/precincts-landing.page <br> | ||
| − | 3 | + | 3. NYPD Sectors: https://data.cityofnewyork.us/Public-Safety/NYPD-Sectors/eizi-ujye <br> |
| − | |||
| − | |||
| − | |||
| − | |||
</p> | </p> | ||
| Line 127: | Line 118: | ||
5. http://www.predpol.com/ <br> | 5. http://www.predpol.com/ <br> | ||
| − | 6. ISSS608: Visual Analytics and Applications: 2017-18 Term1, Group 2 Project <br> | + | 6. [https://wiki.smu.edu.sg/1718t1isss608g1/Group_2_Overview ISSS608: Visual Analytics and Applications: 2017-18 Term1, Group 2 Project] <br> |
| + | |||
| + | <b>Image Sources</b><br> | ||
| + | |||
| + | 1. www.mapsoftheworld.com <br> | ||
| + | |||
| + | 2. https://2016.hackerspace.govhack.org/content/predictive-policing <br> | ||
| + | |||
| + | 3. http://www.badgecreator.com/ <br> | ||
| + | |||
| + | 4. http://www.toledoblade.com/ <br> | ||
| − | + | 5. http://braytih.com.br/ <br> | |
</p> | </p> | ||
Latest revision as of 10:37, 9 August 2018
|
|
|
|
|
|
|
Contents
Introduction
Crime is an act punishable by law that has been timeless and has been committed practically since the start of time. Crime is prevalent in every society. Crime activities are monitored and recorded by law enforcement agencies for various purposes. One such purpose is crime analysis. Crime analysis involves systematic analysis for identifying and analyzing patterns and trends in crime and disorder.
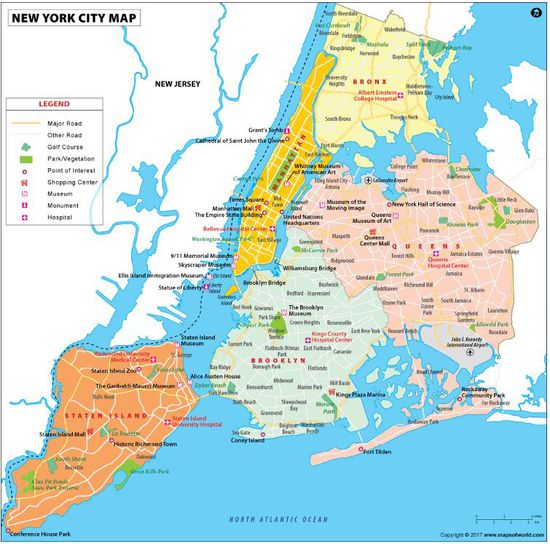
For our crime analysis, we will be using the New York Police Department (NYPD) crime data for the City of New York. The City of New York, or more popularly known as NYC or just New York, is the most populous city in the United States. As of 2017, the population of NYC stands at 8.62 million people. Situated on the Hudson river, NYC consists of 5 boroughs:
1. Brooklyn: Brooklyn is the most populous borough of NYC. It borders the borough of Queens and has several bridge connectors to the boroughs of Staten Island and Manhattan.
2. Queens: Queens is the easternmost and largest in area of the five boroughs of New York City. It is geographically adjacent to the borough of Brooklyn the southwestern end of Long Island. Queens has the most diversified economy of the five boroughs of New York City. It is home to JFK International Airport and LaGuardia Airport.
3. Manhattan: Manhattan is the most densely populated borough of New York City, its economic and administrative centre, and its historical birthplace. Manhattan is often described as the cultural, financial, media, and entertainment capital of the world, and is home to the United Nations Headquarters and Wall Street.
4. The Bronx: The Bronx is the northernmost of the five boroughs of New York City. The Bronx contains one of the five poorest Congressional Districts in the United States, the 15th, but its wide diversity also includes affluent, upper-income and middle-income neighbourhoods.
5. Staten Island: Staten Island is the southernmost and westernmost of the five boroughs of New York City in the U.S. state of New York. Staten Island is the least populated of the boroughs but is the third-largest in land area.
Quick stats of New York City:

Each borough consists of Police Stations which have a demarcated area in the city called Precincts. There are a total of 77 Precincts in NYC. Through our analysis, we hope to provide a comprehensive overview of crime statistics in these 77 Precincts of New York City and illustrate the power of using this data for crime statistics and forecasts for the efficient allocation of Police personnel and resources across Precincts.
Motivation
Crime is an act punishable by law that has been timeless is prevalent in every society. Crime activities are recorded for crime analysis which involves systematic analysis for identifying and analyzing patterns and trends in crime and disorder. In January 2017, The Public Advocate for the City of New York published an open letter to the Commissioner of the New York Police Department (NYPD) addressing the issue of high crime rates in certain neighborhoods of NYC.It points out that the precincts associated with these neighborhoods have shortage of detectives as compared to precincts in neighborhoods with fewer crimes. It talks about an ongoing issue of poor resource allocation and deployment of police personnel with respect to crime numbers. For our crime analysis, we have used the NYPD crime data for the which spans crimes records across the 5 boroughs of NYC which consists of 77 precincts. We aim to provide a visual tool to observe the crime patterns with respect to time and location. On doing this, the rate of crime can be analyzed and hence forecasted for law enforcement agencies can estimate the right number of resources to deploy.
Key Objectives
Through our analysis, we hope to address the following:
1. Provide a visual representation of crime statistics:
Through our visual dashboard, we can provide a one stop view for the exploratory analysis of crime stats. The user will be able to view, compare and analyse crime stats based on type of crime, location, vicinity of crimes and time of day.
2. Forecast of crime numbers at Precinct Level:
We aim to forecast and visualize the number of crimes and calculate crime rates at a Precinct level.
3. Crime Rate Calculation:
Using Crime numbers and population data, we will be calculating the crime rates across each precinct.
Dataset and Description
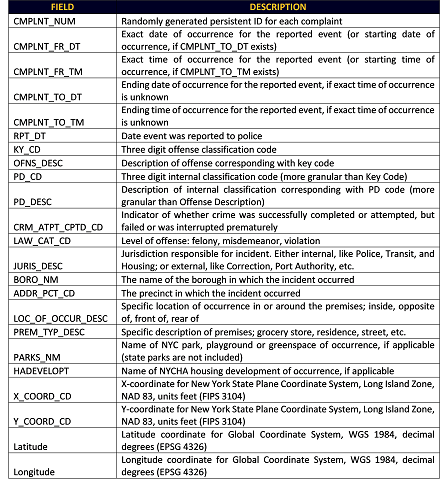
1. NYPD Complaint Data
This is the main dataset in use. It consists of records of crime incidents at the time of system record to the NYPD from 2006 to 2016. The crime incidents range from robberies to larceny.

2. Precinct Data.
The city of New York consists of 77 precincts across the five boroughs. This dataset covers the locations of the police precincts.

3. New York Sector Data
This serves as an additional dataset to identify the patrol areas and boundaries of the individual precincts across the five boroughs.

Project Timeline
Visualization Tools and Packages
For our analysis we propose to use Tableau and R. The following are some of the R packages:
• Dplyr
• Readr
• ggplot2
• tmaps
• ggmaps
• shiny
• shinythemes
• plotly
Dataset Links
1. NYPD Complaint:https://data.cityofnewyork.us/Public-Safety/NYPD-Complaint-Data-Historic/qgea-i56i
2. NYPD Precinct: https://www1.nyc.gov/site/nypd/bureaus/patrol/precincts-landing.page
3. NYPD Sectors: https://data.cityofnewyork.us/Public-Safety/NYPD-Sectors/eizi-ujye
References
1 . Mohler, G., Short, M., Malinowski, S., Johnson, M., Tita, G., Bertozzi, A. and Brantingham, P. (2015). Randomized Controlled Field Trials of Predictive Policing. Journal of the American Statistical Association, 110(512), pp.1399-1411.
2. http://www1.nyc.gov/site/nypd/stats/crime-statistics/crime-statistics-landing.page
3. https://opendata.cityofnewyork.us/
4. https://www.nycgo.com/
5. http://www.predpol.com/
6. ISSS608: Visual Analytics and Applications: 2017-18 Term1, Group 2 Project
Image Sources
1. www.mapsoftheworld.com
2. https://2016.hackerspace.govhack.org/content/predictive-policing
3. http://www.badgecreator.com/
4. http://www.toledoblade.com/
5. http://braytih.com.br/


