Difference between revisions of "ISSS608 2017-18 T3 Assign Pooja Manohar Sawant Data Preparation"
Poojams.2017 (talk | contribs) |
Poojams.2017 (talk | contribs) |
||
| (9 intermediate revisions by the same user not shown) | |||
| Line 1: | Line 1: | ||
<div style=background:#2B3856 border:#A3BFB1> | <div style=background:#2B3856 border:#A3BFB1> | ||
| − | [[Image: | + | [[Image:Abc.jpg |300px]] |
<b><font size = 5; color="#FFFFFF"> Detecting Suspicious Activities at Kasios International</font></b> | <b><font size = 5; color="#FFFFFF"> Detecting Suspicious Activities at Kasios International</font></b> | ||
| Line 20: | Line 20: | ||
| style="font-family:Century Gothic; font-size:100%; solid #1B338F; background:#2B3856; text-align:center;" width="20%" | | | style="font-family:Century Gothic; font-size:100%; solid #1B338F; background:#2B3856; text-align:center;" width="20%" | | ||
; | ; | ||
| − | [[ISSS608_2017-18_T3_Assign_Pooja_Manohar_Sawant_Observations & Insights| <font color="#FFFFFF"> | + | [[ISSS608_2017-18_T3_Assign_Pooja_Manohar_Sawant_Observations & Insights| <font color="#FFFFFF">INSIGHTS AND CONCLUSION</font>]] |
| style="font-family:Century Gothic; font-size:100%; solid #1B338F; background:#2B3856; text-align:center;" width="20%" | | | style="font-family:Century Gothic; font-size:100%; solid #1B338F; background:#2B3856; text-align:center;" width="20%" | | ||
| Line 119: | Line 119: | ||
*To create Workspace2 to determine network of suspicious employees with rest of the organization | *To create Workspace2 to determine network of suspicious employees with rest of the organization | ||
| − | Nodes are created from Suspicious_node.csv – file contains id and labels of suspicious employees. Number of records = 20 | + | **Nodes are created from Suspicious_node.csv – file contains id and labels of suspicious employees. Number of records = 20 |
| − | Edges are created from Suspicious_NW.csv – files contains communication and purchase details to and from suspicious employees to rest of the organization. no. of records = 2172 | + | **Edges are created from Suspicious_NW.csv – files contains communication and purchase details to and from suspicious employees to rest of the organization. no. of records = 2172 |
| − | Layout selected – Yifan Hu | + | **Layout selected – Yifan Hu |
| Line 131: | Line 131: | ||
*To create Workspace3 to answer question 3 | *To create Workspace3 to answer question 3 | ||
To solve Question 3, I have added 3 new employees to suspicious group of people and saved it as "Suspicious_Associated_node_Q3.csv". Also, I extracted their transactions from Info_conc.jmp file by taking inner joins with source and destination, as explained in steps above and saved that file as "Suspicious_Associated_trans_Q3.csv". | To solve Question 3, I have added 3 new employees to suspicious group of people and saved it as "Suspicious_Associated_node_Q3.csv". Also, I extracted their transactions from Info_conc.jmp file by taking inner joins with source and destination, as explained in steps above and saved that file as "Suspicious_Associated_trans_Q3.csv". | ||
| − | + | #Suspicious_Associated_node_Q3.csv - has 23 rows and 2 columns Id and Label | |
| − | + | #Suspicious_Associated_trans_Q3.csv - has 93,733 rows and columns with Source, destination and timeline information. | |
| + | |||
| + | I have imported both of these files in Gephi as nodes and edges respectively and created network graph using Force Atlas 2 Layout. After importing the nodes and edges to Gephi, I have manually removed the other nodes which are not part of extended suspicious group as the intention is to observe suspicious activities within a close group of "bad actors". | ||
| − | |||
[[File:Q3_graph.png|500px|center|]] | [[File:Q3_graph.png|500px|center|]] | ||
<div style="float:center;text-align:center;font-size:12px;"> <u>''Network graph extended "Bad Actors" group''</u> </div> | <div style="float:center;text-align:center;font-size:12px;"> <u>''Network graph extended "Bad Actors" group''</u> </div> | ||
| + | |||
| + | |||
| + | To add time interval, I went to the Data Laboratory, clicked on "Merge Columns and selected event_dt to create time interval. | ||
| + | |||
| + | [[File:Gephi4.jpg|600px|center|]] | ||
| + | <div style="float:center;text-align:center;font-size:12px;"> <u>''Gephi- creation of time interval''</u> </div> | ||
| + | |||
| + | |||
| + | Time interval and automation settings are as below to create a timeline in Gephi - | ||
| + | |||
| + | [[File:Gephi3.jpg|600px|center|]] | ||
| + | |||
| + | === Tableau 2018.1 === | ||
| + | |||
| + | '''To create time series''' | ||
| + | |||
| + | Modified input files (calls, emails, meetings, purchases as well as combined data) which has calculated Event date field, are imported to Tableau. To create a time series graph, drag "Event Dt" to columns and "Number of records" to rows. | ||
| + | |||
| + | [[File:Tableau1.JPG|300px|center|]] | ||
| + | |||
| + | |||
| + | Repeated same procedure for other files. | ||
| + | |||
| + | |||
| + | '''To create Calendar View''' | ||
| + | |||
| + | To see how communications and purchases are distributed over the days of week for 2 and half years, I created a Calendar view for all input files. "Event_dt" is dragged to Columns and selected Year, Month and Week Number of Event_dt. In the Rows, WEEKDAY of the Event_Dt is selected. "SUM(Number of records)" is dragged to Color. Color and Opacity is adjusted to create a clearer visualization. | ||
| + | |||
| + | [[File:Tableau2.JPG|600px|center|]] | ||
Latest revision as of 11:33, 12 July 2018
|
|
|
|
|
|
Contents
About the data
Data provided by the insider has 10 CSV files as below.
| Index | File name | Number of Rows | Description |
|---|---|---|---|
| 1 | calls.csv | 10,606,835 | Call details for entire organization |
| 2 | email.csv | 14,550,085 | Email details for entire organization |
| 3 | meeting.csv | 127,351 | Meeting details for entire organization |
| 4 | purchaces.csv | 762,200 | Purchases details for entire organization |
| 5 | CompanyIndex.csv | 642,631 | Company employee ID and Name list |
| 6 | Suspicious_calls.csv | 70 | Calls details involving suspicious group of people within an organization |
| 7 | Suspicious_emails.csv | 61 | Email details involving suspicious group of people within an organization |
| 8 | Suspicious_meetings.csv | 1 | Meeting details involving suspicious group of people within an organization |
| 9 | Suspicious_purchases.csv | 5 | Purchases details involving suspicious group of people within an organization |
| 10 | Other_suspicious_purchases.csv | 7 | A list of 4 individuals who made 7 suspicious purchases |
All above files except CompanyIndex.csv, have below four fields -
- Source (contains the company ID# for the person who called, sent an email, purchased something, or invited people to a meeting)
- Etype (contains a number designating what kind of connection is made)
- 0 is for calls
- 1 is for emails
- 2 is for purchases
- 3 is for meetings
- Destination (contains company ID# for the person who is receiving a call, receiving an email, selling something to a buyer, or being
- Time stamp – in seconds starting on May 11, 2015 at 14:00.
Tools Used for data preparation and Visualization
- JMP Pro – For data cleaning and transformation
- Tableau – To visualize how communication and purchasing patterns are evolved over a period of 2 and half years in Kasios international
- Gephi – To visualize how suspected employees of Kasios International are connected with each other and with other employees in the organization
Data Preparation
JMP Pro
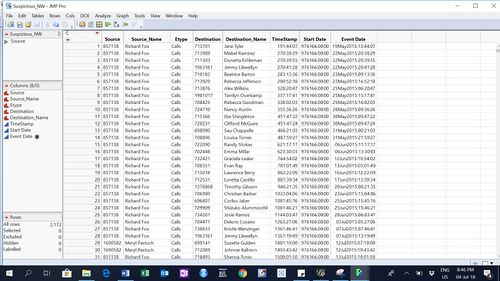
- For 4 organizational level files, imported files to JMP and renamed 4 columns as Source, Etype, Destination, TimeStamp (as input CSV files did not have column names). Also, changed the column's data types.
- Created 2 new columns -
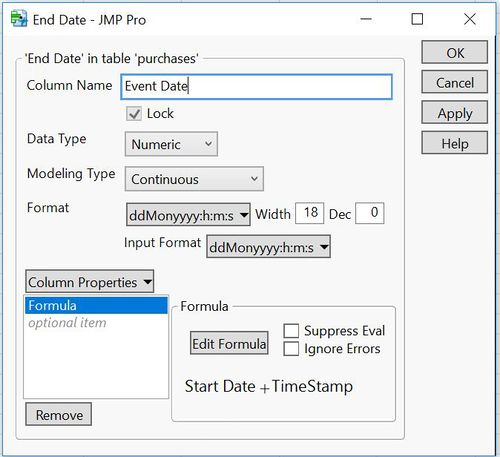
- Start Date – with the single value - May 11, 2015: 14:00
- Event Date – calculated with the formula -
Start Date + TimeStamp
- Appended all 4 files together into Info_Conc which contains 26,046,471 rows and saved as text file.
- Also, joined this file with CompanyIndex file to add source and destination names to file.
- Similarly a consolidated file is created to append all suspicious communications and purchases details in Suspicious_conc which contains 137 rows.
- Selected suspicious people’s extended network by taking overlapping of suspicious employees file with the whole organization file Info_conc. Inner join of whole network with suspicious employee file is taken by matching source from Info_conc with employee id. Similarly, destination is matched with the employee id and then these 2 resultant files were concatenated. This file contains 2,172 rows.
Gephi 0.9.2
- To create Workspace1 to determine network of suspicious employees
- Nodes are created from Suspicious_node.csv – file contains id and labels of suspicious employees. Number of records = 20
- Edges are created from Suspicious_conc.csv – file contains source and target with employee ids. number of records = 137
- Layout selected – Force Atlas 2
- To create Workspace2 to determine network of suspicious employees with rest of the organization
- Nodes are created from Suspicious_node.csv – file contains id and labels of suspicious employees. Number of records = 20
- Edges are created from Suspicious_NW.csv – files contains communication and purchase details to and from suspicious employees to rest of the organization. no. of records = 2172
- Layout selected – Yifan Hu
- To create Workspace3 to answer question 3
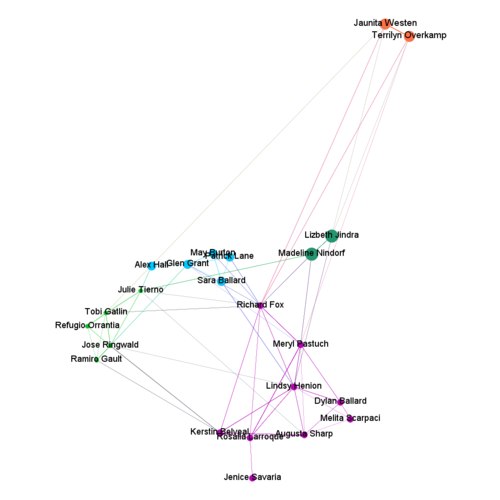
To solve Question 3, I have added 3 new employees to suspicious group of people and saved it as "Suspicious_Associated_node_Q3.csv". Also, I extracted their transactions from Info_conc.jmp file by taking inner joins with source and destination, as explained in steps above and saved that file as "Suspicious_Associated_trans_Q3.csv".
- Suspicious_Associated_node_Q3.csv - has 23 rows and 2 columns Id and Label
- Suspicious_Associated_trans_Q3.csv - has 93,733 rows and columns with Source, destination and timeline information.
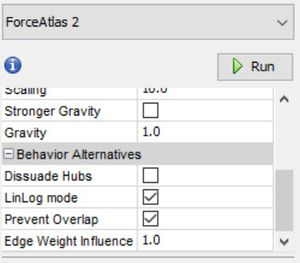
I have imported both of these files in Gephi as nodes and edges respectively and created network graph using Force Atlas 2 Layout. After importing the nodes and edges to Gephi, I have manually removed the other nodes which are not part of extended suspicious group as the intention is to observe suspicious activities within a close group of "bad actors".
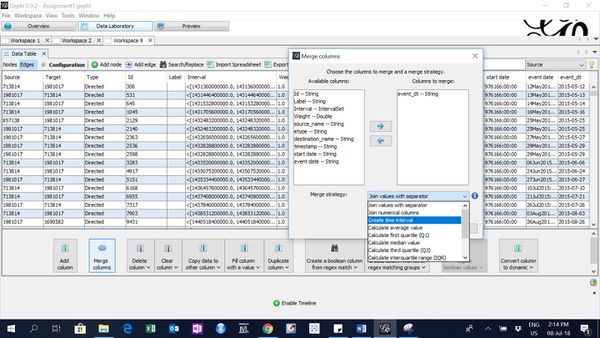
To add time interval, I went to the Data Laboratory, clicked on "Merge Columns and selected event_dt to create time interval.
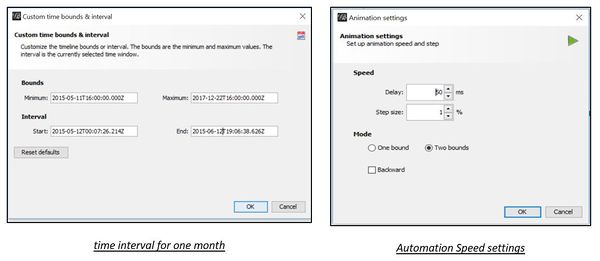
Time interval and automation settings are as below to create a timeline in Gephi -
Tableau 2018.1
To create time series
Modified input files (calls, emails, meetings, purchases as well as combined data) which has calculated Event date field, are imported to Tableau. To create a time series graph, drag "Event Dt" to columns and "Number of records" to rows.
Repeated same procedure for other files.
To create Calendar View
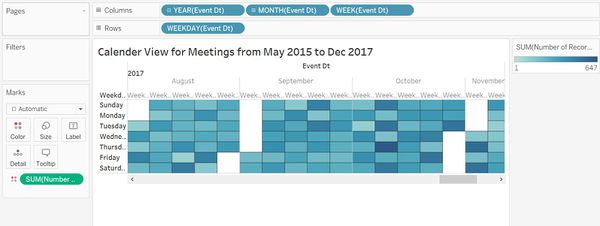
To see how communications and purchases are distributed over the days of week for 2 and half years, I created a Calendar view for all input files. "Event_dt" is dragged to Columns and selected Year, Month and Week Number of Event_dt. In the Rows, WEEKDAY of the Event_Dt is selected. "SUM(Number of records)" is dragged to Color. Color and Opacity is adjusted to create a clearer visualization.

