Difference between revisions of "ISSS608 2017-18 T3 Assign Saurav Jhajharia (Q3)"
Sauravj.2017 (talk | contribs) |
Sauravj.2017 (talk | contribs) |
||
| Line 59: | Line 59: | ||
8.Selenium (Busrakhan, Chai, Kannika, Sakda, Somchair): The rise of this chemical has been seen in many locations for the years 2008 to 2009. It might be useful to find data about this chemical's presence in recent times as it might be a toxic addition to the environment. | 8.Selenium (Busrakhan, Chai, Kannika, Sakda, Somchair): The rise of this chemical has been seen in many locations for the years 2008 to 2009. It might be useful to find data about this chemical's presence in recent times as it might be a toxic addition to the environment. | ||
| − | Missing data for 2013 and 2009-2014 for Total hardness in the water. | + | <b>Missing data for 2013 and 2009-2014 for Total hardness in the water.</b> |
As seen from the graphs below, data for the missing year 2013 would have been very helpful to understand and interpret the manner in which the difference between values of 2012 and 2014 occurred. This is because there is a clear sudden jump visible in 2014 for this chemical in almost all locations. | As seen from the graphs below, data for the missing year 2013 would have been very helpful to understand and interpret the manner in which the difference between values of 2012 and 2014 occurred. This is because there is a clear sudden jump visible in 2014 for this chemical in almost all locations. | ||
Revision as of 23:04, 9 July 2018
VAST Challenge 2018 MC2: Like a Duck to Water
Q3
After reviewing the data, do any of your findings cause particular concern for the Pipit or other wildlife? Would you suggest any changes in the sampling strategy to better understand the waterways situation in the Preserve?
Cause of concern
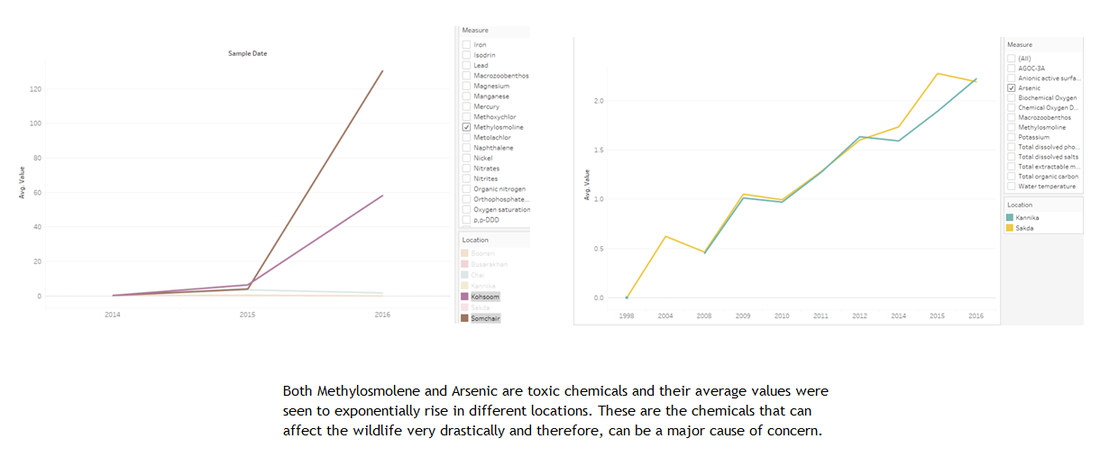
After analyzing the data so far and looking at the different dashboards, I have realized that the cause of concern for Pipit or other wildlife is the constant rise in the value of chemicals over the years. Methylosmolene, the chemical classified to be highly toxic, was seen to be rising over the years exponentially in a few locations.
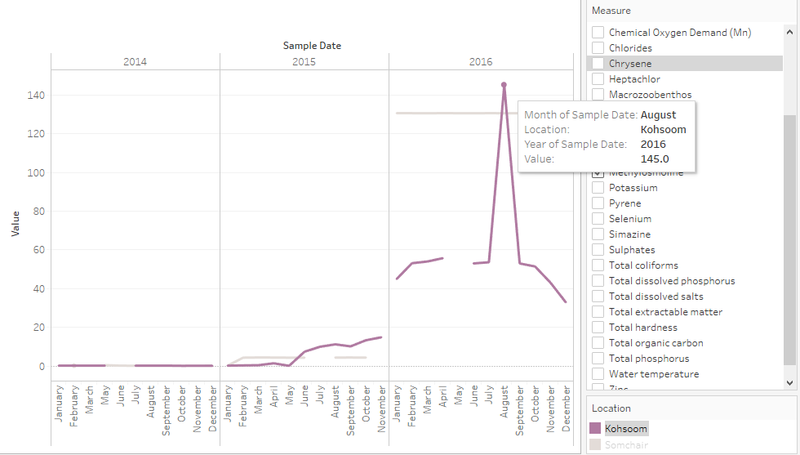
Diving deep into this data, we can see that there was a suspicious jump in the level of Methylosmolene in Kohsoom in August 2016. This chemical's presence was also seen in the soil to have increased, and the suspicion was that it is due to the dumping of harmful chemicals that this had happened.
While this is one example, there are many such chemicals showing an upward trend in their average value over the years. All such chemicals were filtered and kept for further analysis and visualizations. The Tableau public file showing all these chemicals with their visible trends can be accessed here.
Sampling strategy
There were many chemicals for whom enough data wasn't available for understanding the exact nature of their behavior. They were either missing data at critical points of time or were not taken consistently over a time period long enough to be judged on.
Chemicals for whom more recent data would have helped analysis:
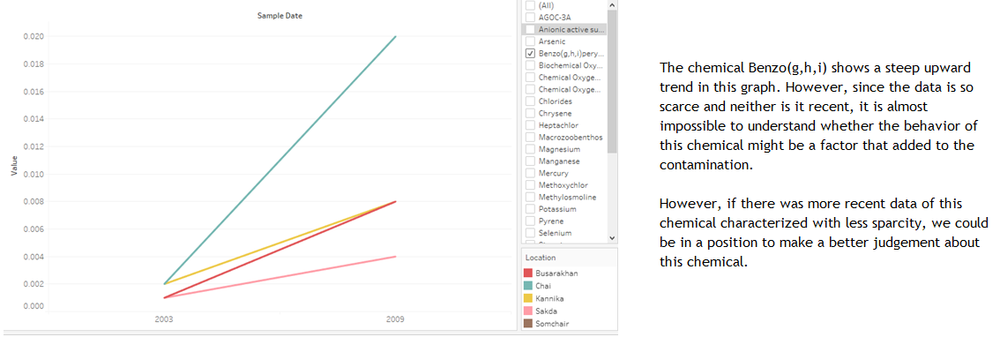
1. Benzoperoxide (all locations)
2. Arsenic (Boonsari)
3. Chrysene (Boonsari)
4. Heptachlor (Kannika)
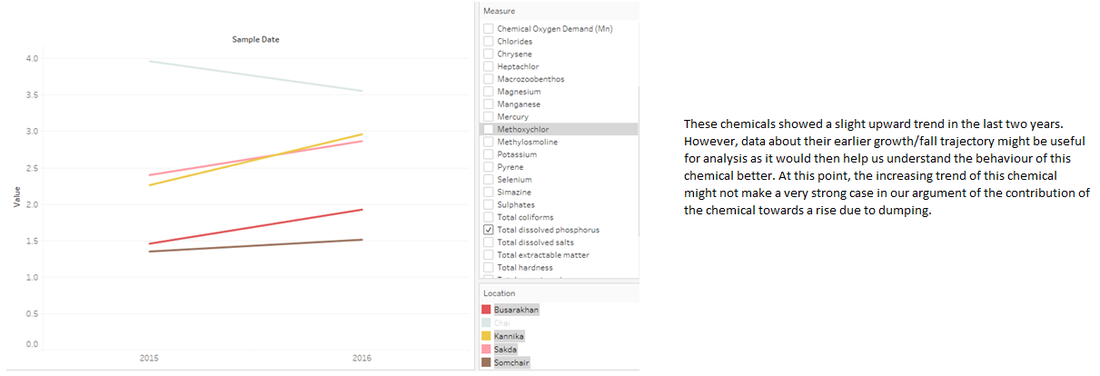
5. Methoxychlor (Boonsri and Kohsoom)
6. Pyrene (Boonsari)
7. Total coliforms (Kohsoom): Data for this chemical peaked in 2009 randomly. Although it stabilized its way till 2013, it might be important to see its current value in Kohsoom.
8.Selenium (Busrakhan, Chai, Kannika, Sakda, Somchair): The rise of this chemical has been seen in many locations for the years 2008 to 2009. It might be useful to find data about this chemical's presence in recent times as it might be a toxic addition to the environment.
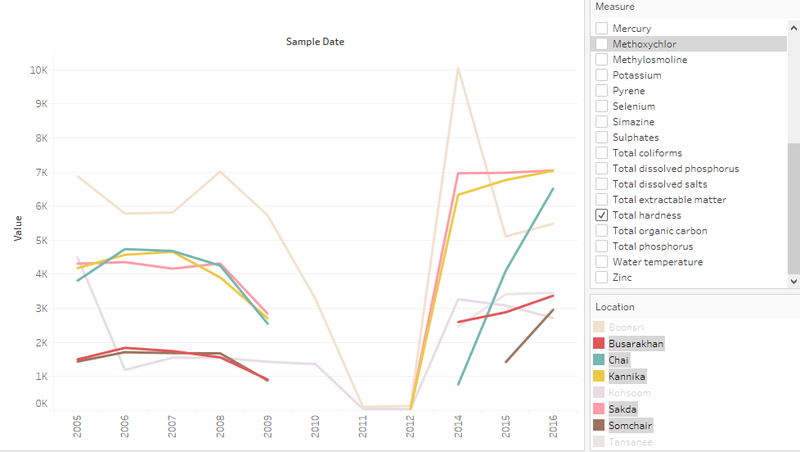
Missing data for 2013 and 2009-2014 for Total hardness in the water.
As seen from the graphs below, data for the missing year 2013 would have been very helpful to understand and interpret the manner in which the difference between values of 2012 and 2014 occurred. This is because there is a clear sudden jump visible in 2014 for this chemical in almost all locations.
There are 5 locations in which there was an upward trend (and surprisingly a very similar trend) seen for the total hardness in water. If there was available data between 2009-2013, this analysis would have been much more fruitful for our investigators. At this point, it is clearly visible that there was a sharp rising trend here.
