From Visual Analytics and Applications
Jump to navigation
Jump to search
|
|
| Line 92: |
Line 92: |
| | <br>We can find that the number of samples before 2004 is very small, which may lead to the inaccuracy estimates of water quality for the past years. But the samples became very large between 2005 and 2009, and it returns to the same level as 2004 after 2011. | | <br>We can find that the number of samples before 2004 is very small, which may lead to the inaccuracy estimates of water quality for the past years. But the samples became very large between 2005 and 2009, and it returns to the same level as 2004 after 2011. |
| | </td> | | </td> |
| − | <td>[[File:Figure_2.1.jpg|300px|center]]</td> | + | <td>[[File:Figure_2.1.jpg|700px|center]]</td> |
| | </tr> | | </tr> |
| | <tr> | | <tr> |
Latest revision as of 22:36, 9 July 2018
VAST Challenge 2018 MC2:
Like a Duck to Water
QUESTION 1
| Patterns |
Visualization |
| 1. General Trends in years
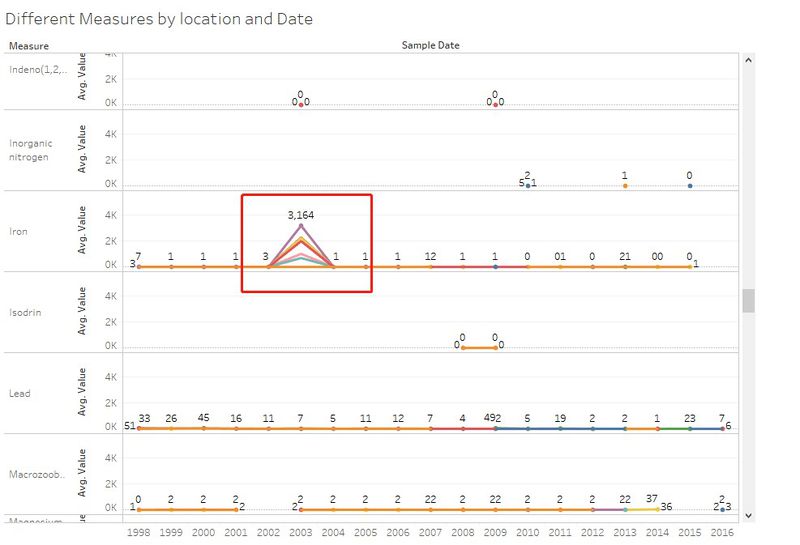
First we will have a look at the all the measures in different locations and different measures:
We can find that the average value of Iron in almost all of the locations has a vast increase during 2002 to 2003. Especially In the water of Kosoom, the Iron content has the largest change, which increased from 3mg/l to 3164mg/l.
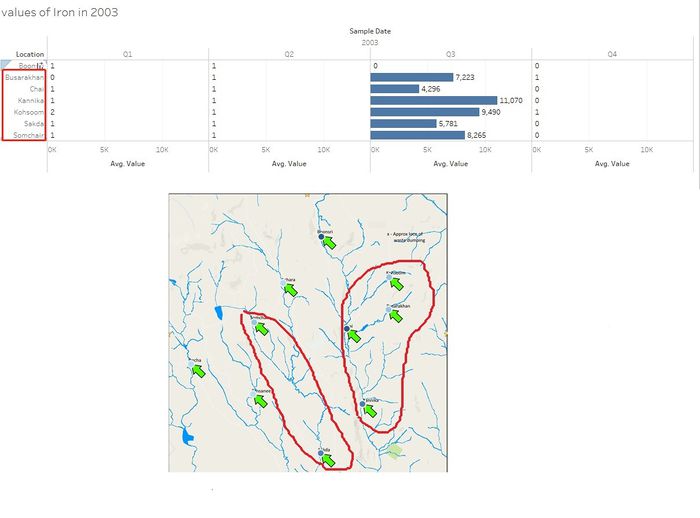
If we dril down to the water quality readings in 2003, we can find that all of the places which suddenly contains so much Iron ,can be divided into two different groups because they lie on two different rivers:
so we think the main reason of this situation is probably the Kasios Furniture Company dumped their polluted waste to the river near Kohsoom and the waste carried by river polluted other places.
|
|
| 2. Toxicological indicators Trends
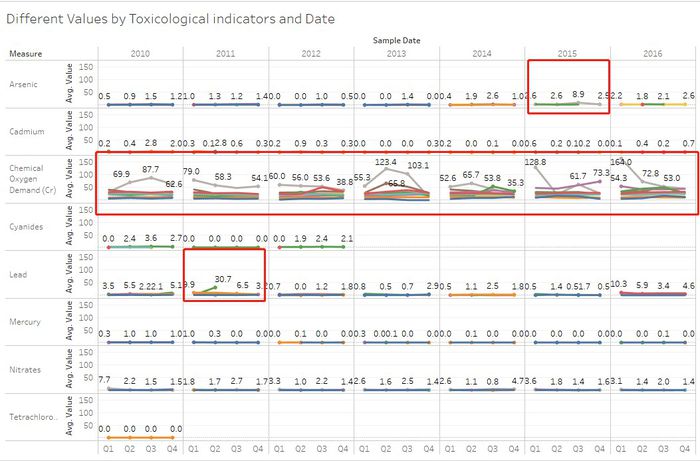
Next we will see the the values of Toxicological indicators in different locations in recent years.
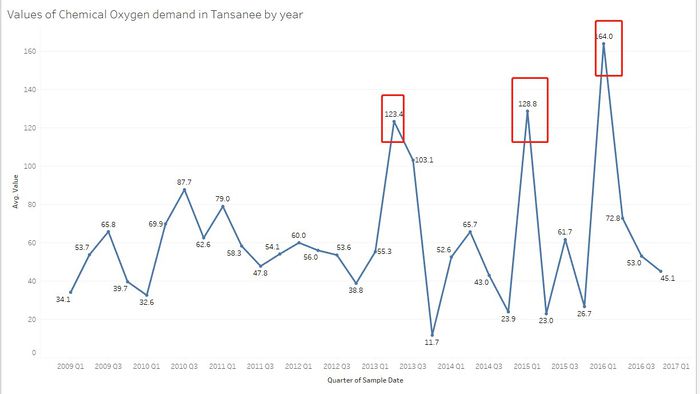
We can see that most of the Chemicals in the water are very stable. But the value of Arenic has a sudden increase to 8.9mg/L in 2015Q3 in Tansanee. The value of Lead in 2011Q2 also suddenly increased to 30.7mg/L. And the Chmical Oxygen Demand(Cr) in Tansanee is very unstable in recent years. So next we will drill down to the Arenic and the Lead to see what happens.
|
|
| 3. Toxicological indicators Drilling Down
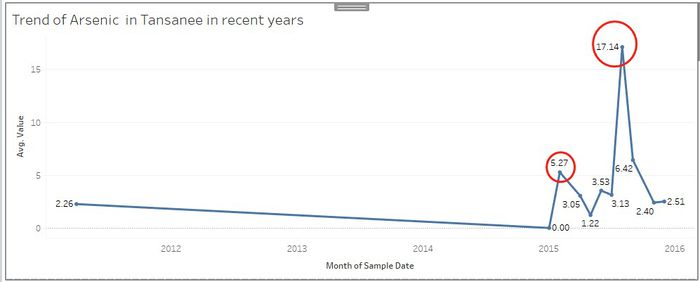
After drilling down to the value of Arsenic in recent years:
We can find that there is no Arsenic in the water in Tansanee between 2011-2015, but it suddenly incereased to 5.27mg/L in February 2015. Finally, it comes to 17.14mg/L in Agust.
For the Chemical oxygen Demand(Cr):
We can see that it has a trend after 2013.the value of Chemical Oxygen Demand always increase in odd year and decrease in even year, which is very interesting.
|
|
| 4. Total coliforms and Total dissolved Salts Trends
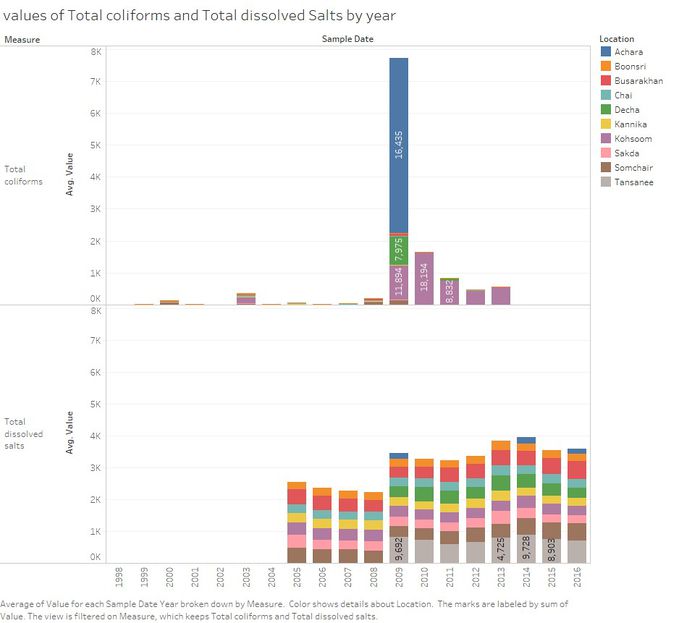
Finally we will see the value of Total coliforms and Total dissolved Salts in different places and different years:
We can see that the Total coliforms in most of the locations are very low before 2009. But the average value suddenly increased in Achara in 2009. After that it decreased to 0. So we think it should be a outlier. And the average value in Kohsoom was very stable since 2009, it remained between 1614mg/L to 459mg/L. the reason of this situation could be some chemical reactions happened because of the polluted waste of Kasios Furniture Company. And the environment of water is very suitable for the living of coliforms.
For the value of total dissolved salts, we can this chemical measure in all of the palces has increased since 2006.
|
|
QUESTION 2
| Patterns |
Visualization |
| 1. Years and Months heatmap
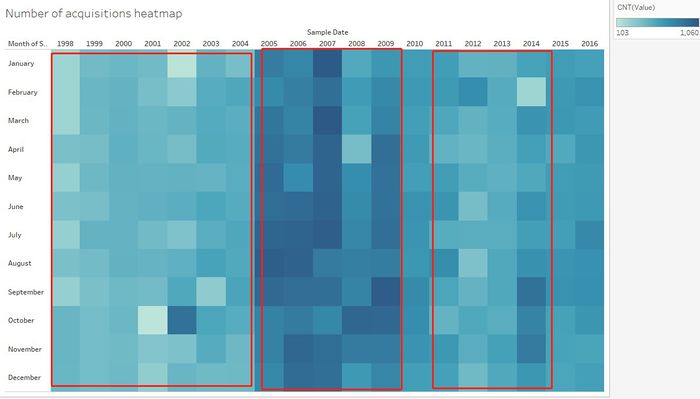
For the anomalies, First we create the heatmap of years and months:
We can find that the number of samples before 2004 is very small, which may lead to the inaccuracy estimates of water quality for the past years. But the samples became very large between 2005 and 2009, and it returns to the same level as 2004 after 2011.
|
|
| 2. Heatmap of different Month and Weekdays and Locations
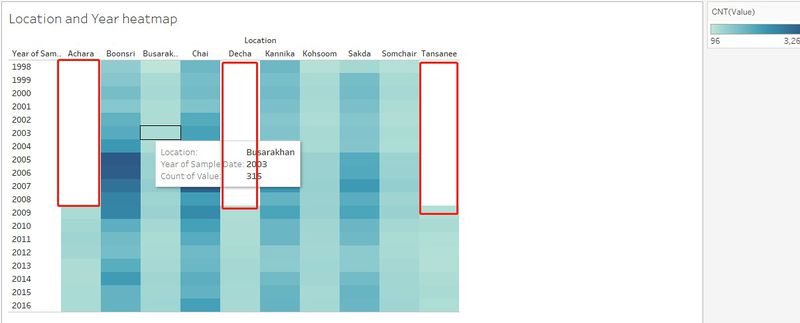
Then we create the heatmap between months and weekdays and between different locations and years:
We can see that most of the samples was collected in Thursday, Friday and Sunday. And there are many missing values in different locations.
We think that the number of samples in different periods should be the same closely as much as possible so that we can make the resault of visualization more accurate. Moreover, samples can change if we do not collect as soon as possible. The Chemical measures may floate far away with the water, which will lead us to the wrong direction.
|
|
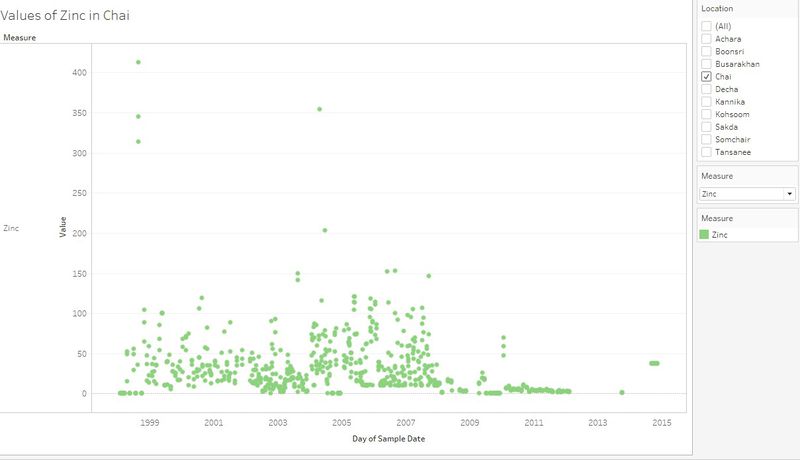
| 3. the Values of Zinc in Chai
We can find that some values are repeated many times in one day. We do not know whether it is a mistake. But we think that if we need to collected more than once, we should use the average value of this set, not just record.
|
|
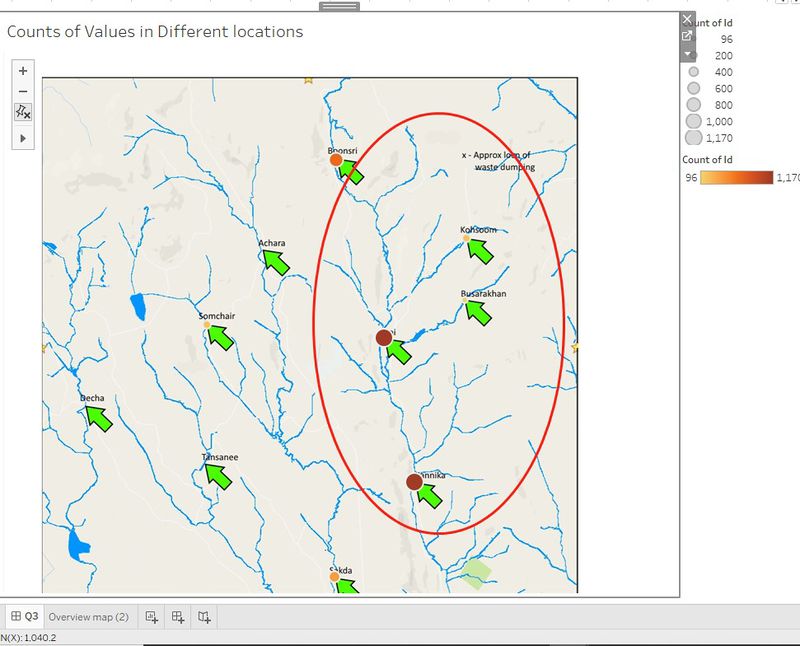
| 4. Geo-map of the count of values in different locations
We can see that most of the values were collected in the meiddle area, which contains Boonsri, Chai, Kannika, and Sakda. We could get the wrong conclusion because the lcak of other areas. So we when we collecting data, we should cover the all area.
|
|
|
(2) Anormalous affects
This anomalous figure may have a large effect on the range or average and could disrupt the overall results. In the event an anomalous figure is thrown up, the researcher will usually look into it a little further and see if he can come up with a rational explanation. He might include this explanation in his findings so that other people can make greater sense of the results.
(3) Apprently the Hydrology Department did not collect sufficient data to understand the comprehensive situation across the preserve. They collected more data between Thursday to Saturday then that from Sunday to Wednesday, and their collection was focus on 2005-2009. Moreover, it contains many missing values in different values in different locations.
(4) All of this insufficient data will affect our results. So as we mentioned above, we should collect the data on time and as soon as possible.
|
QUESTION 3
| Patterns |
Visualization |
| 1. Findings and Concerns Found
All of the polluted waste which dumped bt Kasios Furniture Company, will floate far away in the water, which means it will pollute other locations. So far we can drow the conclusion that the right part of this area have been polluted, and it is spreading to the left. We should do more precautions in Achara and Sikda to prevent the Left part of this area from being polluted.
|
|

