Difference between revisions of "ISSS608 2017-18 T3 Assign Yang Zhengyan Data Preparation"
Zyyang.2017 (talk | contribs) |
Zyyang.2017 (talk | contribs) |
||
| (8 intermediate revisions by the same user not shown) | |||
| Line 15: | Line 15: | ||
| style="font-family:Century Gothic; font-size:100%; solid #1B338F; background:#F0F8FF; text-align:center;" width="20%" | | | style="font-family:Century Gothic; font-size:100%; solid #1B338F; background:#F0F8FF; text-align:center;" width="20%" | | ||
; | ; | ||
| − | [[ISSS608 2017-18 T3 Assign Yang | + | [[ISSS608 2017-18 T3 Assign Yang Zhengyan_Methodology|<b><font size="3"><font color="#2c3e50 ">Methodology</font></font></b>]] |
| style="font-family:Century Gothic; font-size:100%; solid #1B338F; background:#F0F8FF; text-align:center;" width="20%" | | | style="font-family:Century Gothic; font-size:100%; solid #1B338F; background:#F0F8FF; text-align:center;" width="20%" | | ||
; | ; | ||
| − | [[ISSS608 2017-18 T3 Assign Yang | + | [[ISSS608 2017-18 T3 Assign Yang Zhengyan_Insights| <b><font size="3"><font color="#2c3e50 ">Insights</font></font></b>]] |
| style="font-family:Century Gothic; font-size:100%; solid #1B338F; background:#F0F8FF; text-align:center;" width="20%" | | | style="font-family:Century Gothic; font-size:100%; solid #1B338F; background:#F0F8FF; text-align:center;" width="20%" | | ||
| Line 35: | Line 35: | ||
|- | |- | ||
| | | | ||
| − | * Id: Identification number for the record (only for bookkeeping) | + | * Id: Identification number for the record (only for bookkeeping) with 136824 records |
| − | *Value: Measured value for the chemical or property in this record | + | *Value: Measured value for the chemical or property in this record range from 0 to 37959.28 |
| − | * Location: Name of the location sample was taken from. See the map for geo-location of the sampling site. | + | * Location: Name of the location sample was taken from. See the map for geo-location of the sampling site. Total 10 sites. |
| − | * Sample Date: Date sample was taken from the location | + | * Sample Date: Date sample was taken from the location from 1998 to 2016 |
| − | * Measure: Chemicals (e.g., Sodium) or water properties (e.g., Water temperature) measured in the record | + | * Measure: Chemicals (e.g., Sodium) or water properties (e.g., Water temperature) measured in the record |
|} | |} | ||
</div> | </div> | ||
| Line 65: | Line 65: | ||
===Variable distribution=== | ===Variable distribution=== | ||
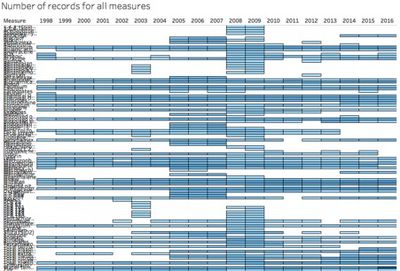
| − | There are 10 locations, 106 measures in the dataset. So it is very difficult to apply all measures into the analysis. And we need to characterize the past and most recent situation with respect to chemical contamination in the Boonsong Lekagul waterways. So I filter out the reading values with recent years first (2011-2016) and exclude the remaining | + | There are 10 locations, 106 measures in the dataset. So it is very difficult to apply all measures into the analysis. And we need to characterize the past and most recent situation with respect to chemical contamination in the Boonsong Lekagul waterways. So I filter out the reading values with recent years records first (2011-2016) and exclude the remaining measures. |
[[File:YANGZHENGYANPic1.jpg|400px|center]] | [[File:YANGZHENGYANPic1.jpg|400px|center]] | ||
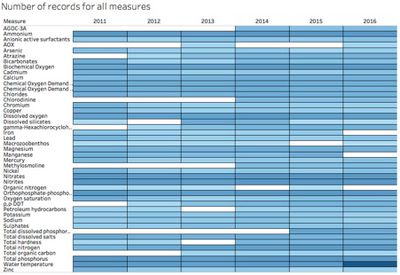
| − | The following screens showing the variables | + | The following screens showing the variables selected at dataset when filter out measured not used anymore. |
[[File:YANGZHENGYANPic2.jpg|400px|center]] | [[File:YANGZHENGYANPic2.jpg|400px|center]] | ||
| − | + | We can see there is a lot of data gaps and not sufficient records from a consistent date. | |
===Variable clustering=== | ===Variable clustering=== | ||
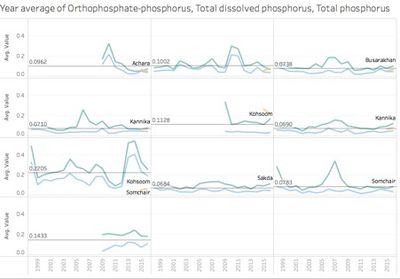
| − | Through initial data exploration, there are some types of measures with similar trend and values, e.g Orthophosphate-phosphorus, Total dissolved phosphorus, Total phosphorus. So we need to exclude those similar measures and remain | + | Through initial data exploration, there are some types of measures with similar trend and values, e.g Orthophosphate-phosphorus, Total dissolved phosphorus, Total phosphorus. So we need to exclude those similar measures and remain typical one for further investigation. |
[[File:YANGZHENGYANPic3.jpg|400px|center]] | [[File:YANGZHENGYANPic3.jpg|400px|center]] | ||
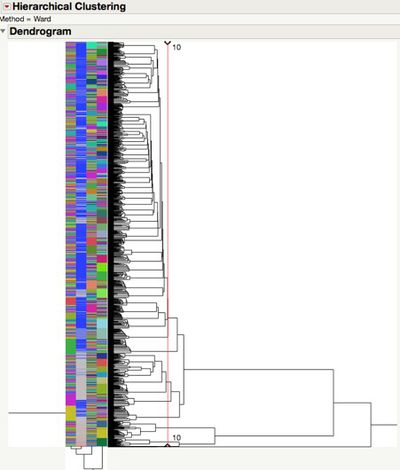
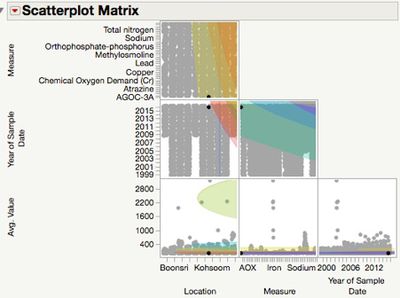
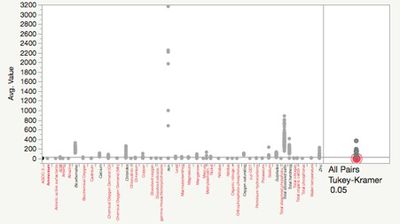
| − | + | Hierarchical clustering can handle those categorical data. So I put those records into 10 clusters, and check the scatterplot matrix after clustering. For the mean value comparison across all measures. We can check the pairs comparisons by Tukeu-Kramer HSD method. | |
[[File:YANGZHENGYANPic4.jpg|400px|center]][[File:YANGZHENGYANPic5.jpg|400px|center]] | [[File:YANGZHENGYANPic4.jpg|400px|center]][[File:YANGZHENGYANPic5.jpg|400px|center]] | ||
And then, we can see the difference between each measure and exclude those with very similar pattern reading value. | And then, we can see the difference between each measure and exclude those with very similar pattern reading value. | ||
[[File:YANGZHENGYANPic6.jpg|400px|center]] | [[File:YANGZHENGYANPic6.jpg|400px|center]] | ||
| − | + | Last but not least, 19 measures are selected to check the insights. | |
| + | [[File:YANGZHENGYANPic22.jpg|400px|center]] | ||
| + | ==Mapping Geo-coordination== | ||
| + | |||
| + | Because there is no direct coordination with the dataset, We can input background and find out the geo-code by adding annotation into each location. The following one is the coordination of each location.After getting the geo-code, we can join two table with corresponding locations. <br> | ||
| + | Boonsri 137.4 211.3<br> | ||
| + | Kannika 174.6 61<br> | ||
| + | Chai 159.72 127.97<br> | ||
| + | Kohsoom 196.92 175.09<br> | ||
| + | Somchair 77.37 134.92<br> | ||
| + | Achara 102.68 167.65<br> | ||
| + | Busarakhan 197.41 144.83<br> | ||
| + | Decha 20.33 96.72<br> | ||
| + | Sakda 136.9 15.87<br> | ||
| + | Tansanee 75.89 68.95<br> | ||
| + | [[File:YANGZHENGYANPic23.jpg|400px|center]] | ||
Latest revision as of 20:11, 9 July 2018
|
|
|
|
|
|
Contents
Data Description
Data field
|
Sample Data:
id,value,location,sample date,measure
2221,2,Boonsri,11-Jan-98,Water temperature
2223,9.1,Boonsri,11-Jan-98,Dissolved oxygen
2227,0.33,Boonsri,11-Jan-98,Ammonium
2228,0.01,Boonsri,11-Jan-98,Nitrites
2229,1.47,Boonsri,11-Jan-98,Nitrates
2230,0.06,Boonsri,11-Jan-98,Orthophosphate-phosphorus
2231,0.09,Boonsri,11-Jan-98,Total phosphorus
2232,13.9,Boonsri,11-Jan-98,Sodium
Data tools
|
Variable distribution
There are 10 locations, 106 measures in the dataset. So it is very difficult to apply all measures into the analysis. And we need to characterize the past and most recent situation with respect to chemical contamination in the Boonsong Lekagul waterways. So I filter out the reading values with recent years records first (2011-2016) and exclude the remaining measures.
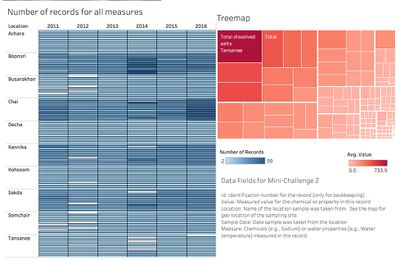
The following screens showing the variables selected at dataset when filter out measured not used anymore.
We can see there is a lot of data gaps and not sufficient records from a consistent date.
Variable clustering
Through initial data exploration, there are some types of measures with similar trend and values, e.g Orthophosphate-phosphorus, Total dissolved phosphorus, Total phosphorus. So we need to exclude those similar measures and remain typical one for further investigation.
Hierarchical clustering can handle those categorical data. So I put those records into 10 clusters, and check the scatterplot matrix after clustering. For the mean value comparison across all measures. We can check the pairs comparisons by Tukeu-Kramer HSD method.
And then, we can see the difference between each measure and exclude those with very similar pattern reading value.
Last but not least, 19 measures are selected to check the insights.
Mapping Geo-coordination
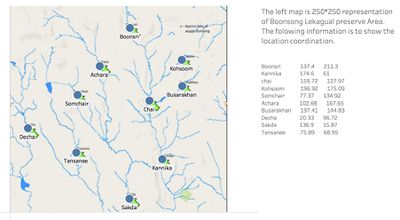
Because there is no direct coordination with the dataset, We can input background and find out the geo-code by adding annotation into each location. The following one is the coordination of each location.After getting the geo-code, we can join two table with corresponding locations.
Boonsri 137.4 211.3
Kannika 174.6 61
Chai 159.72 127.97
Kohsoom 196.92 175.09
Somchair 77.37 134.92
Achara 102.68 167.65
Busarakhan 197.41 144.83
Decha 20.33 96.72
Sakda 136.9 15.87
Tansanee 75.89 68.95

