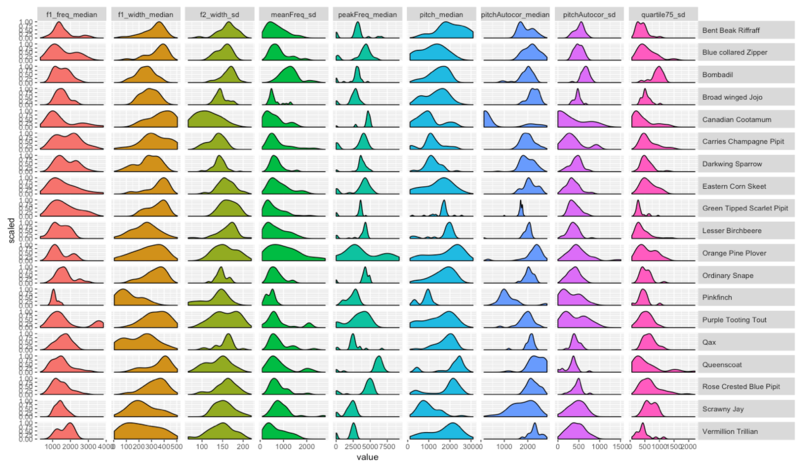
File:Density plot q2 visual method.png
Jump to navigation
Jump to search

Size of this preview: 800 × 463 pixels. Other resolutions: 320 × 185 pixels | 1,266 × 733 pixels.
Original file (1,266 × 733 pixels, file size: 597 KB, MIME type: image/png)
File history
Click on a date/time to view the file as it appeared at that time.
| Date/Time | Thumbnail | Dimensions | User | Comment | |
|---|---|---|---|---|---|
| current | 10:58, 7 July 2018 | | 1,266 × 733 (597 KB) | Runyu.wang.2017 (talk | contribs) | |
| 00:42, 7 July 2018 |  | 1,266 × 733 (597 KB) | Runyu.wang.2017 (talk | contribs) |
- You cannot overwrite this file.
File usage
The following page links to this file: