REMGIS Proposal
Contents
- 1 Project Motivation
- 2 Project Objectives
- 3 Data Preprocessing
- 4 Related Works
- 5 Methodology
- 6 Web Application Design
- 7 Application Architecture
- 8 Application Overview
- 9 Interesting Findings
- 10 Project Timeline
- 11 Project Challenges
- 12 Project Tools & Technologies
- 13 References
Project Motivation
Project Objectives
1. Analyze the factors that make Singapore’s CBD successful
 a. Identify and study the make-up of professional services within Singapore’s CBD
 b. Examine the landmarks that contribute to the CBD’s success
 c. Understand the factors that influence business locations
2. Replicate and evaluate Singapore’s CBD success factors to the upcoming second business district - Jurong Lake District
Data Preprocessing
Data Source
| S/N | Description | Source |
|---|---|---|
| 1 | Legal | http://www.yellowpages.com.sg/search/all/Legal |
| 2 | Bank | http://www.yellowpages.com.sg/category/banks |
| 3 | Accountancy | http://www.yellowpages.com.sg/search/all/Accountancy |
| 4 | Architectural | http://www.yellowpages.com.sg/search/all/Architectural |
| 5 | Management Consultancy | http://www.yellowpages.com.sg/search/all/Management+Consultancy |
Data Collection
To retrieve the records of all companies in these industries, we performed data scraping on all the companies in the above-mentioned sectors found in the Yellow Pages’ website using R. Once all the companies’ records were retrieved successfully, they were written and saved to a CSV file.
Data Cleaning
One of the problems with the data was that there were some companies that had incorrect postal codes. The incorrect postal codes followed two particular patterns – the first is that the postal code only had 5 digits while the second is that the postal code had a starting postal district which did not correspond to that of Singapore’s. These records had to be manually found by looking through each company’s address and finding postal codes that exhibited either one of the two patterns or both.
After addressing the postal code issue, we realized that for the data to be usable in R, we needed to retrieve the latitude and longitude coordinates of each company. This was done by using the "geocode" function from the "ggmap" package.
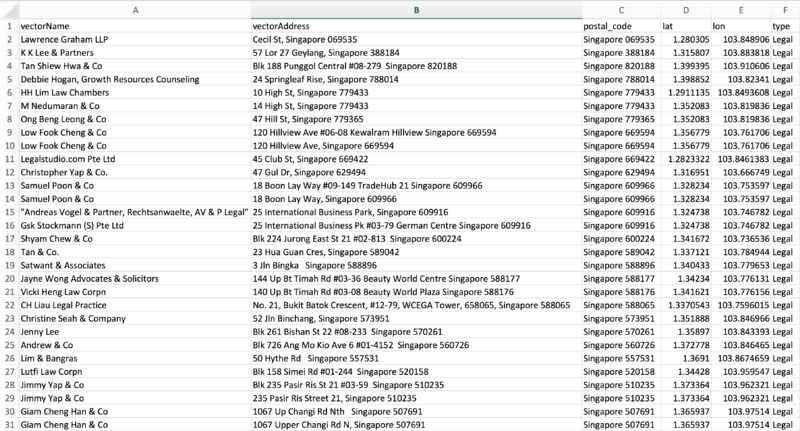
Here is a snippet of what the finalized dataset looks like:
Related Works
London’s Central Business District
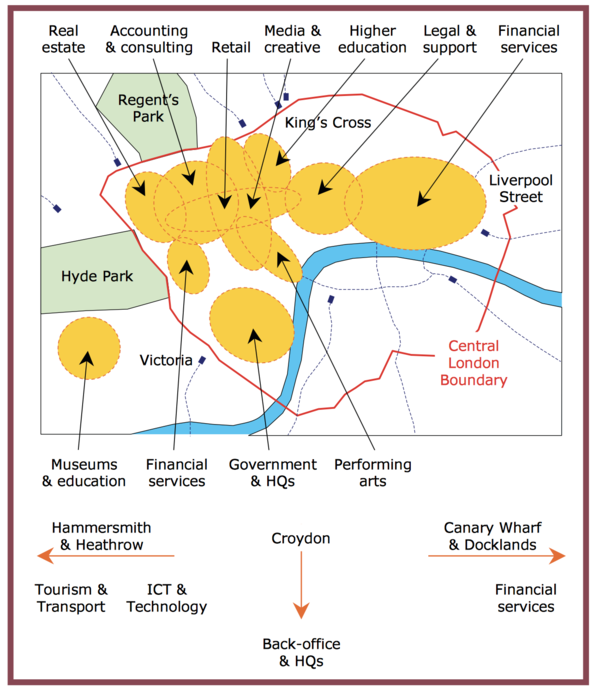
Goal of study: Examine the range of London’s CBD activities, dynamism and competition of the CBD, the agglomeration of the various types of industries as well as the CBD’s future opportunities.
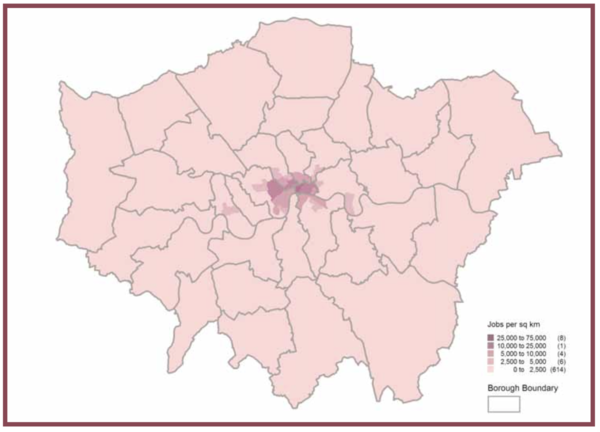
Kernel density estimation was used to measure the number of professional services’ jobs density per square kilometer. Although we were more interested in the makeup of firms in the CBD and not the number of jobs or employment, we decided that they could build upon this idea and apply kernel density estimation analysis on the various types of firms in Singapore’s CBD instead. By analysing the spread of firms in each industry across the current CBD, we can better understand the location and extent of clustering of these core professional services in the CBD.
Guangzhou and Shenzhen
Goal of study: Analyze the cartographic definition and representation of the CBD by studying its urban development and functions.
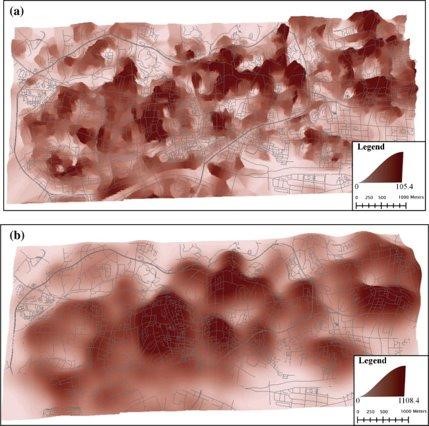
A concentration index is presented to visualize the urban environment by using a density surface that is refined with network distances instead of Euclidean ones. At the end of the study, one of the conclusions of the paper stated that area-based methods of urban analysis such as kernel density estimation are widely used for the purposes of generating a continuous surface with density attribute. This was a positive indication to us to carry on with the initial idea of performing kernel density estimation analysis to analyze the makeup of firms in the CBD and JLD.
Methodology
Location Quotient Analysis
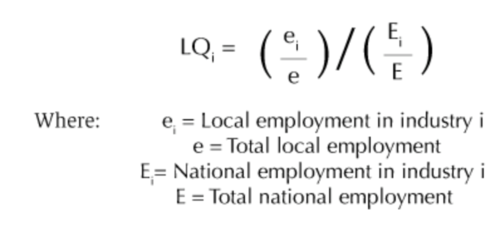
One of the ways to measure success was to determine if the region’s local needs are being met. As a result, we decided to analyse the location quotient values of the five sectors within the CBD and JLD areas, then form our conclusions.
Kernel Density Estimation
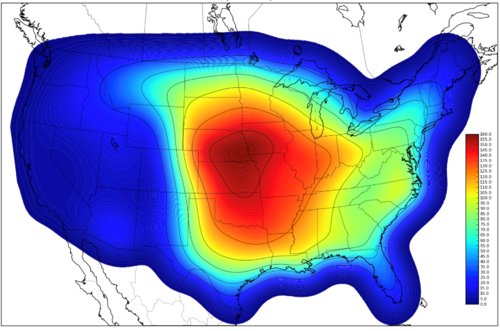
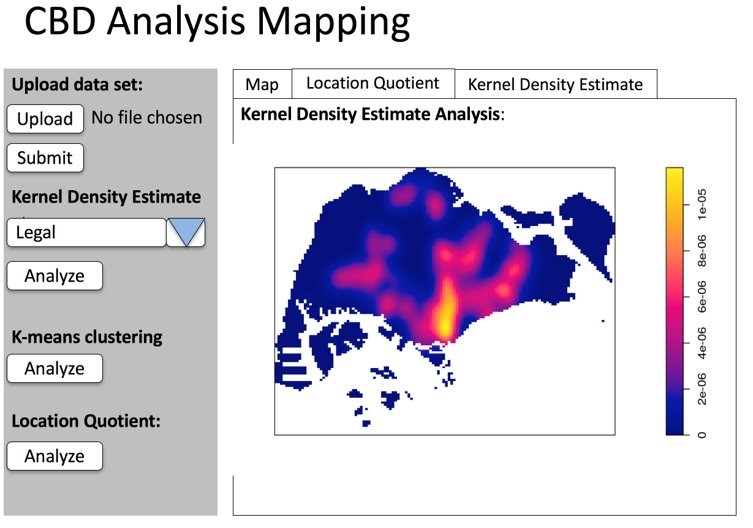
To find out about the density of each sector in the CBD, we decided to apply kernel density estimation. This would help to show the density of the various sectors as well as examine which areas of the CBD are more and less dense.
Quadrat Analysis
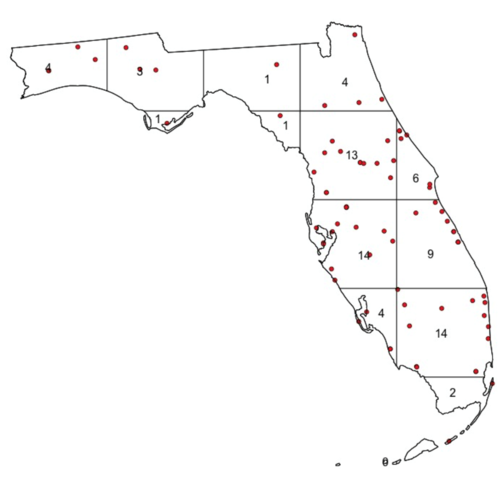
To determine if firms in the CBD are evenly spaced or clustered, we decided to use a quadrat analysis. We wanted to conduct a test of Complete Spatial Randomness for the 5 industry point patterns, based on quadrat counts before by using the quadrat.test() function of the “spatstat” package.
For the analysis, we will be performing a Monte Carlo simulation with 1000 trails instead of chi-squared tests, as this would obviate the need for all quadrat expected counts to be at least 5 as we noticed in the pre-run that the spatial points of all firms may range from 0 to x number in the CBD window.
Web Application Design
Inspiration
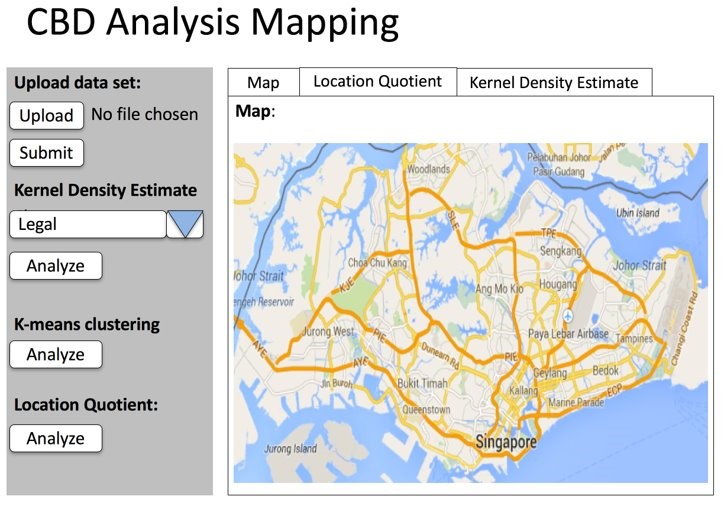
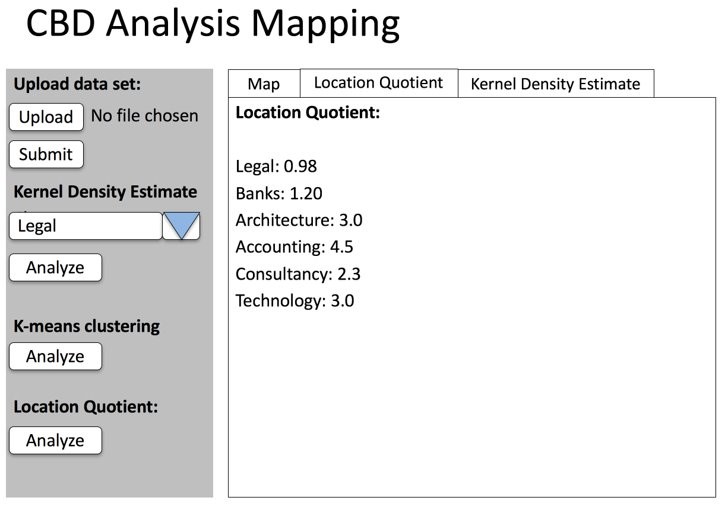
We gathered inspiration for the application’s UI by looking through and using multiple projects that were done by past groups. We took and combined elements that we liked then came up a storyboard for our own application.
Storyboard
Application Architecture
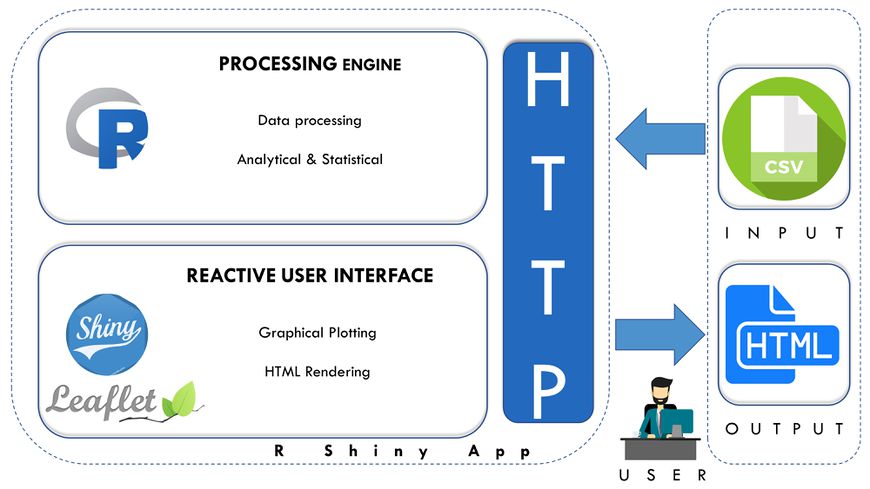
Architecture Overview
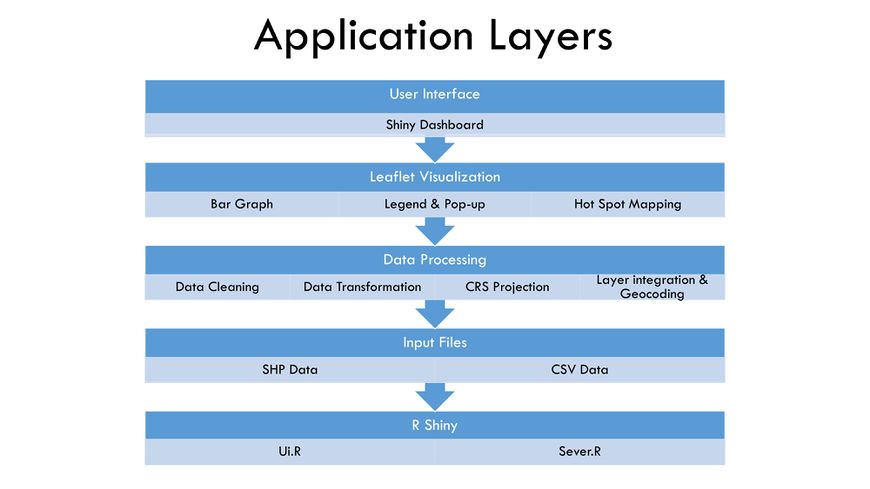
Application Layers
Application Overview
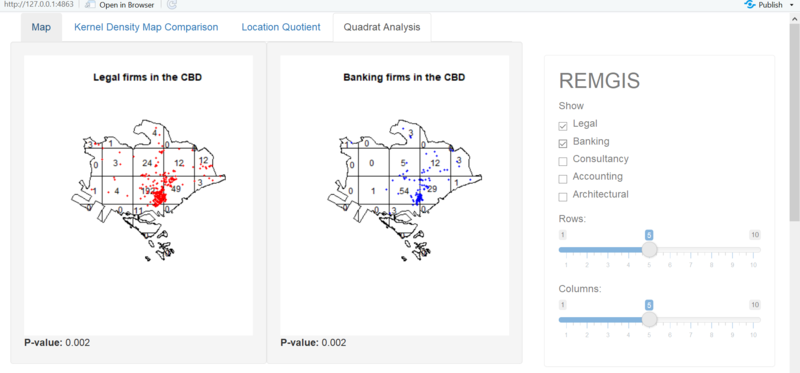
Map Tab
Features
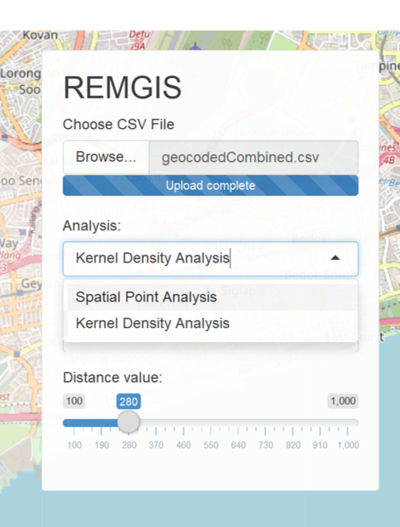
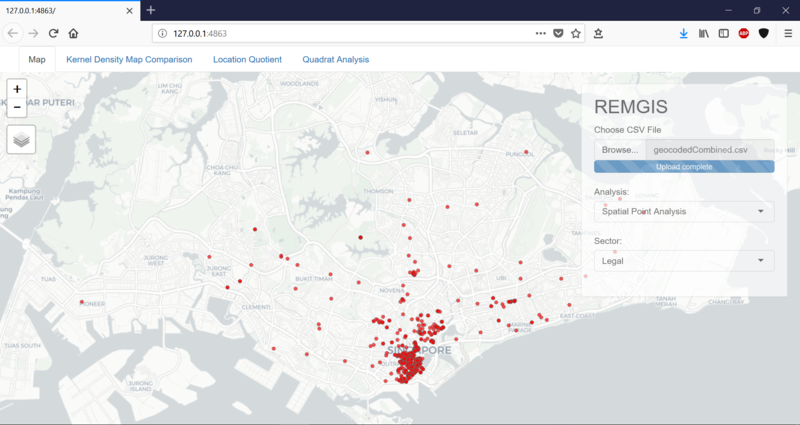
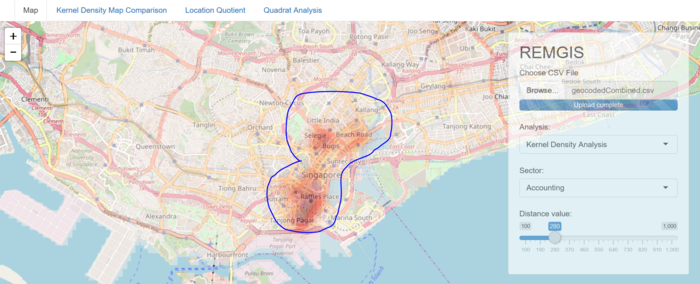
- Allows user to upload their own firms data
- The format of the firms data must be in a csv file and in the same format as the data collected from our scrapping script, template of data format can be downloaded for the future.
- Allows user to select the analysis to perform
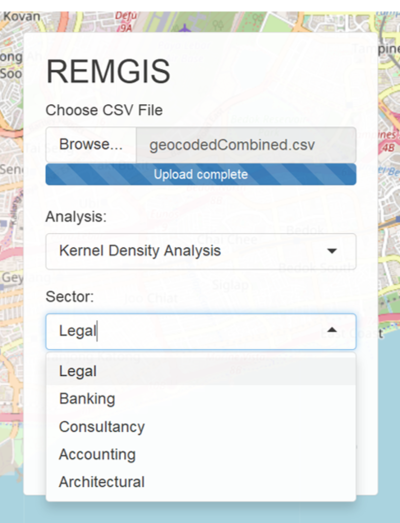
- Allows user to select the respective sector on the map
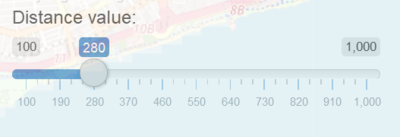
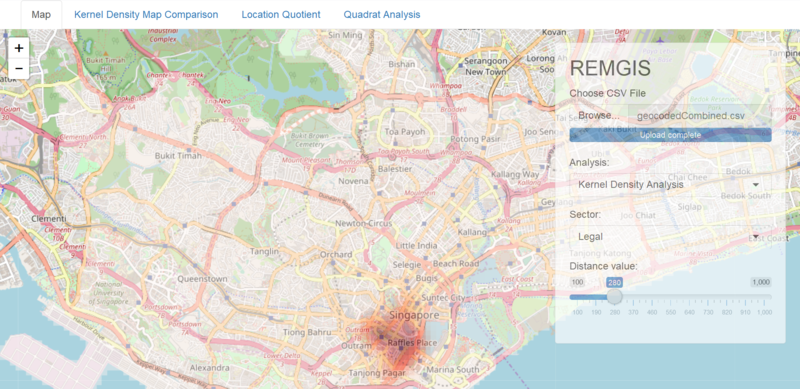
- The bandwidth of the Kernel Density plot.
- Smoother plot will be seen with a larger kernel distance while a smaller kernel distance will lead to a plot with more noise.
Spatial Point Analysis
KDE Analysis
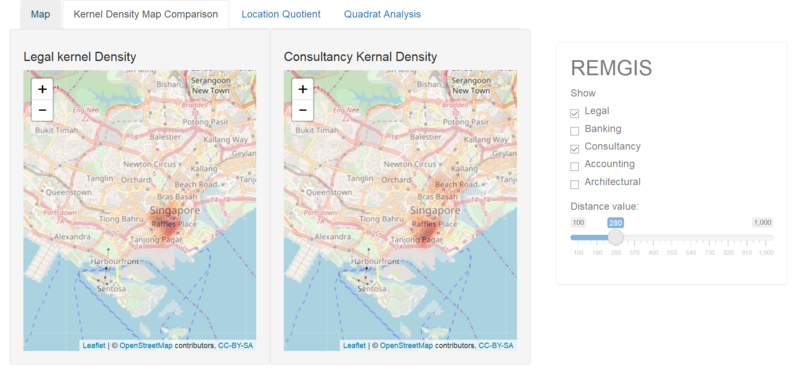
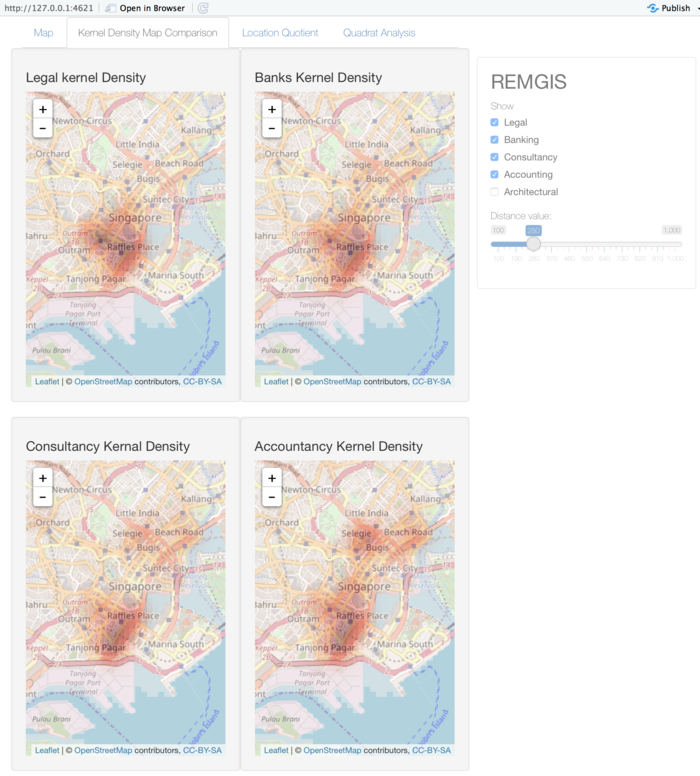
Kernel Density Map Comparison Tab
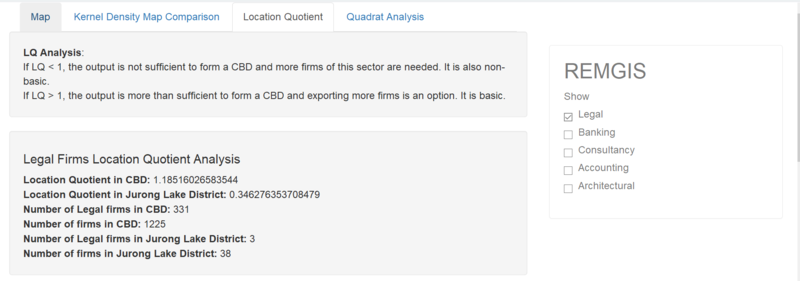
Location Quotient Tab
Features
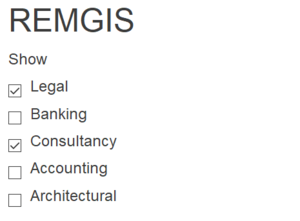
- Allows user to toggle the respective sector on the map
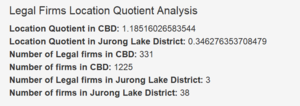
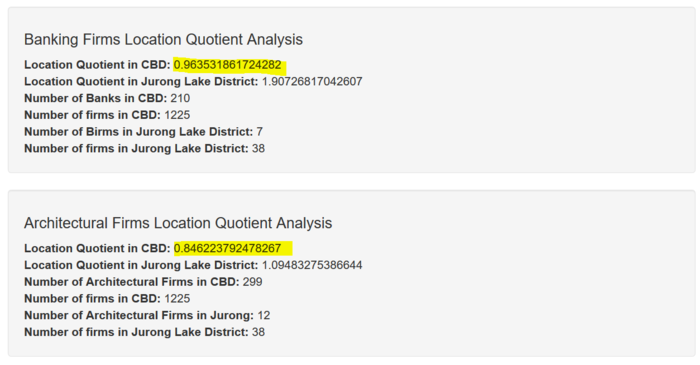
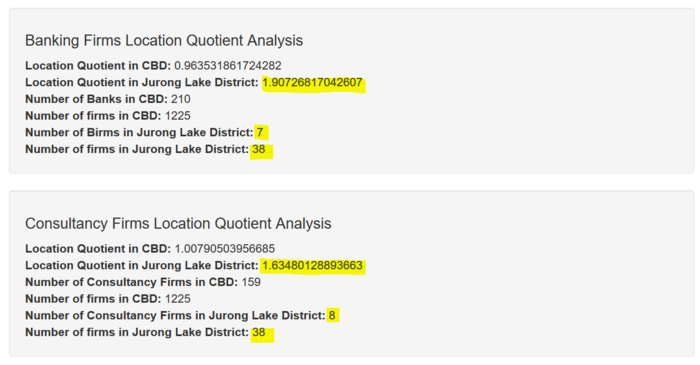
- Shows LQ figures for both CBD and JLD
- Shows Number of firms in respective regions
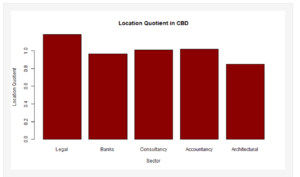
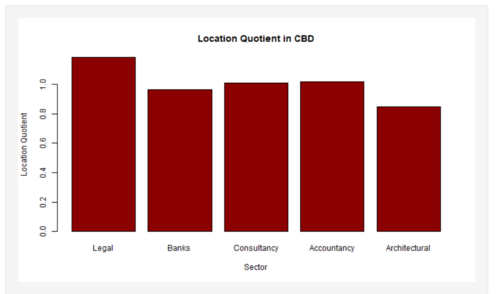
- Overview of CBD LQ in Bar Chart
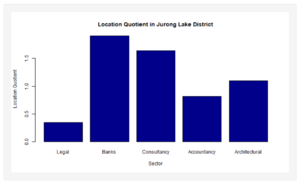
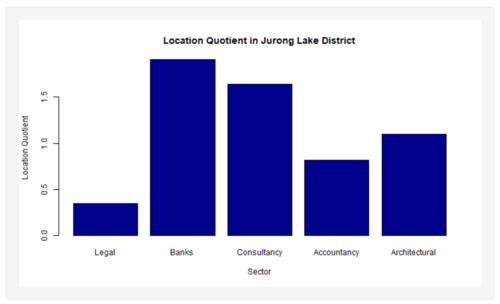
- Overview of JLD LQ in Bar Chart
Quadrat Analysis Tab
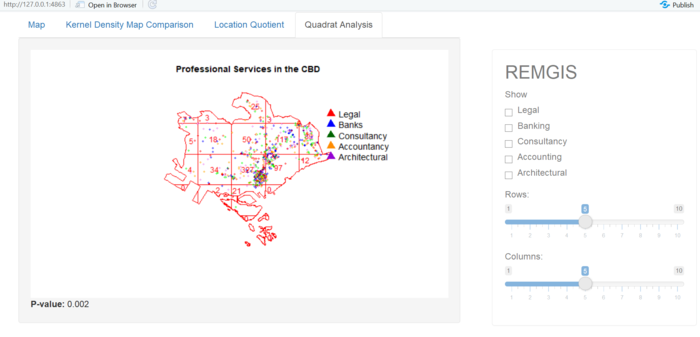
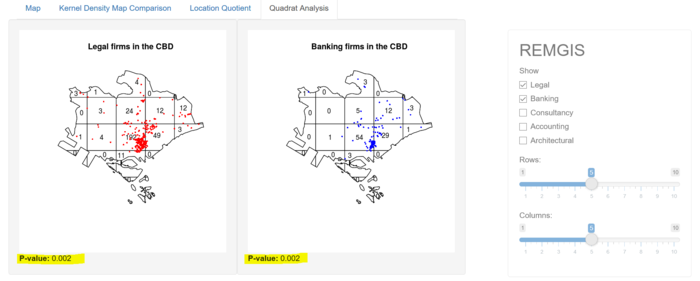
Features
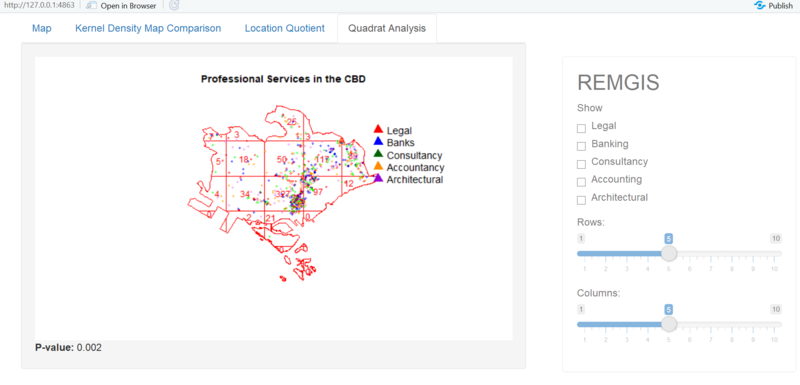
- Allows user to toggle the respective sector on the map
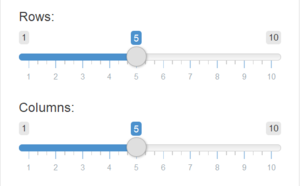
- Select respective rows and columns for the quadrat map
All Professional Firms
Selected Firms
Interesting Findings
Location Quotient Analysis
Key Finding #1: Some CBD Firm Types Have LQ < 1
As successful as the CBD is, the team observed that there are some types of firms in the CBD that do not have > 1 LQ such as Architectural (LQ: 0.8462238) and Bank (LQ: 0.9635319) firms. Although this is so, the LQ values are still very close, indicating that the current amount of these firms are somewhat sufficient to meet the local regional demands.
Key Finding #2: Severe Lack of Legal Firms in JLD
There is a severe lack of Legal firms in the JLD (LQ: 0.3462764) compared to other firm types which have LQ values of > 1. In contrast, the LQ for Legal firms in the CBD is > 1 (LQ: 1.18516). This suggests that more emphasis should be placed on setting up Legal firms in the JLD.
Key Finding #3: High JLD LQ Values
Certain firm types in the JLD seem to have LQ values that are too high compared to the rest, such as Consultancy (LQ: 1.634801) and Bank (LQ: 1.907268). This is a clear indicator that less of these firm types should be set up in the JLD while other firm types with low LQ values should be prioritized.
KDE Analysis
Key Finding #1: Clustering of Firms at Telok Ayer and Marina Bay Financial Centre
Looking at the current CBD makeup, the window used to demarcate the entire central region of Singapore shows that firms tend to cluster at the Telok Ayer and Marina Bay Financial Centre areas. Each industry tends to find a rather similar intensity clustered at the same location. This shows that in order to make up a CBD, the intensity of firms in each industry should be rather similar and should be clustered in a close proximity or in the same area as the other industries.
Key Finding #2 Water Body Nearby in Current CBD Cluster
Considering how the current CBD is clustered near the Marina Reservoir, there could possibly be a correlation between a CBD's makeup in Singapore and a nearby water body. This could be due to aesthetic purposes of companies looking for office spaces with a good view. Additionally, geomancy reasoning also suggests that the area behind the Marina Reservoir symbolizes wealth as water flows and wealth are closely associated. Hence, we can expect firms that will be set up in the Jurong Business District to be clustered near the Pandan Reservoir or Chinese Garden along the International Business Park in Jurong East due to the water body’s presence to attract abundance, wealth and success.
Key Finding #3: Accountancy Firms Stretch Furthest in the Cluster
Accounting firms stretch the furthest in the kernel density heatmap out of the CBD and into the Jalan Besar and Beach Road areas. This shows that Accountancy firms have a wider spread for its cluster. Hence, when considering such data by moving firms to Jurong, it can be considered the incentives used to poach Accounting firms to Jurong might not necessarily be that of the typical features of a CBD, but more so of factors like cost for example while keeping some of the features of the CBD and ensuring they with solutions and ways to handle them.
Quadrat Analysis
Key Finding #1: Most Firms Form Clusters near Downtown Core
Singapore’s CBD shows that the clustering of firms is very prominent along the boundaries of the Downtown Core with 327 firms in one quadrat and some smaller clusters toward the Central-East. 97 and 117, 89 firms around the Museum, Rochor, Kallang and Geylang boundaries.
Key Finding #2: Monte Carlo test p-value of 0.002
The Monte-Carlo statistic is large and the is p-value smaller than 0.05 Reject the null hypothesis that the point patterns are randomly distributed. The statistic further strengthens the analysis that clustering is present
Project Timeline
Project Challenges
| S/N | Challenges | Solutions |
|---|---|---|
| 1 | Data Scraping API is not readily accessible from Yellow Pages |
|
| 2 | Geocoding from postal codes to X and Y coordinates to perform thematic mapping |
|
| 3 | Inexperienced with R Shiny package and R programming |
|
| 4 | Unfamiliar with the implementation of spatial analysis methods such as:
|
|
Project Tools & Technologies
|
No. |
Name |
Date |
Comments |
|
1. |
Insert your Name here |
Insert Date here |
Insert Comment here |
|
2. |
Insert your Name here |
Insert Date here |
Insert Comment here |
|
3. |
Insert your Name here |
Insert Date here |
Insert Comment here |
References
[1] Location Quotients: A Tool for Comparing Regional Industry Compositions. (2006, March). Retrieved March 29, 2018, from http://www.incontext.indiana.edu/2006/march/1.asp
[2] London’s Central Business District: Its global importance. (2008). 1-56. Retrieved March 5, 2018, from https://www.london.gov.uk/sites/default/files/gla_migrate_files_destination/londons-cbd-jan08.pdf.
[3] Yu, W., Ai, T, & Shao, S. (2015, May). The analysis and delimitation of Central Business District ... Retrieved March 6, 2018, from https://www.researchgate.net/publication/276683014_The_analysis_and_delimitation_of_Central_Business_District_using_network_kernel_density_estimation

