1718t2is415T2 G3 MyHawker ProjectDetails
Contents
Visualizing The Accessibility of Hawker Centres
Motivation
Hawker centres are a unique aspect of Singaporean culture, where people from all walks of life are able to enjoy local food. Besides offering delicacies from different cultures and having a clean and hygienic environment for the comfort of everyone, it is important for hawker centres to be situated at accessible locations. Furthermore, with the ageing population in Singapore, ensuring that hawker centres are accessible (i.e. is within walkable distance and is connected to public transport) is even more beneficial to them. With NEA being the main regulator our hawker centres, they have announced plans to build 20 new hawker centres in Singapore. With this in mind, we thought about how we could provide value to their planning through analysis and evaluations of current and future developments.
Objectives
- Access accessibility of hawker centres in Singapore by analyzing current locations of hawker centres, residential areas as well as transport routes
- Find out if there is a shortage or surplus of hawker centres in certain areas
- Propose possible areas for future hawker centre developments
Data Sources
Singapore map and location of public hawker centres:
- https://data.gov.sg/dataset/master-plan-2014-subzone-boundary-web
- https://data.gov.sg/dataset/singapore-residents-by-subzone-and-type-of-dwelling-june-2016
- https://data.gov.sg/dataset/hawker-centres
Location of private hawker centres:
- Kopitiam - http://www.kopitiam.biz/search-results/
- Food Junction - https://www.foodjunction.com/outlets/
- Koufu - http://www.koufu.com.sg/casual-dining/koufu-singapore
Location of private and private residential and bus stop
- http://download.bbbike.org/osm/bbbike/Singapore/
- https://www.mytransport.sg/content/mytransport/home/dataMall/static-data.html
Cleaning and Processing:
- 42 data points of private hawker centres automatically scrapped (http://webscraper.io/), geocoded from a website (https://www.doogal.co.uk/BatchGeocoding.php), converted to SVY21 (http://dominoc925.blogspot.com/p/svy21-coordinate-converter.html), included column of point of interest and seating capacity in csv.
- 115 data points of public hawker centres obtained from shapefile, geocoded to SVY21 using QGIS, included column of point of interest and seating capacity in csv.
- 4,861 data points of bus stops obtained from shapefile, geocoded to SVY21 using QGIS, included column of subzone name using master plan 2014 subzone web shapefile in csv.
- 12,578 data points of residential obtained from shapefile, included centroid and geocoded to SVY21 using QGIS, included column of subzone name and population using singapore residents by sub zone and type of dwelling June 2016 in csv.
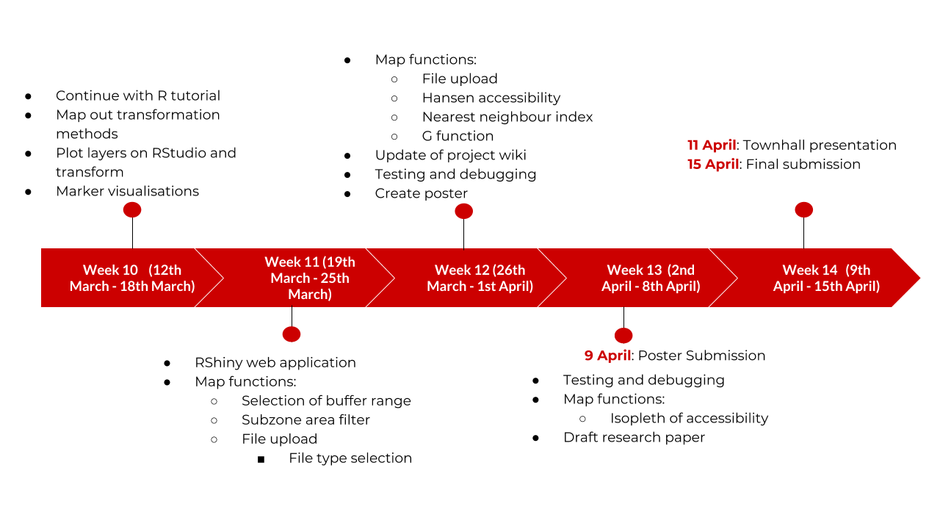
Timeline and Milestones
Key Challenges
Projection of coordinates can be an issue, it get projected out of Singapore
Unfamiliar with R and R Shinny, it takes more time to learn
Tools and Technologies
QGIS
References
TBC
Comments
|
No. |
Name |
Date |
Comments |
|
1. |
Insert your Name here |
Insert Date here |
Insert Comment here |
|
2. |
Insert your Name here |
Insert Date here |
Insert Comment here |
|
3. |
Insert your Name here |
Insert Date here |
Insert Comment here |

