Access-the-Excess Research Paper
Abstract - Mapping the schools to these fast food, we can study whether there is a relationship between obesity in students and the presence of fast food nearby schools.
Keywords – Kernel Density Model, spatial point analysis
I. Introduction
According to the 2015 report by the international diabetes foundation, Singapore has the second highest proportion of diabetics among developed nations. This is a growing concern especially when the rising obesity in children and young adults are most likely to push the rate of diabetes and such an issue can bring a huge cost to the society in terms of medical treatment and indirect productivity losses. The cost is estimated to be more than $1billion in 2010 and is expected to soar above $2.5 billion by 2050.
Diabetic also increases the risk of other illness such as risk of blindness. The root of many illness, such as diabetes, is obesity. Prolonged unhealthy eating habits are the reason for obesity and many other diseases.
Our team believe healthy eating habits should be cultivated from young. Hence, our project will look into proximity and concentration of fast food to primary and secondary school.
Mapping the schools to these fast food, we can study whether there is a relationship between obesity in students and the presence of fast food nearby schools.
II. Project Objectives
With the use of Geographic Information System (GIS), the application will aid Health Promotion Board (HPB) in:
1. Highlighting the need for better planning of food stores in close proximity to schools.
2. Making decision not to place fast food too near schools
3. Reviewing the list of “healthy fast food”
4. Enabling HPB to have better campaign for healthy living
III. Related Work
The development of public health GIS applications, which include those that deals with obesity have increased over the years due to wide availability of geocoded location and health data which makes the use of GIS in public heath more sophisticated.
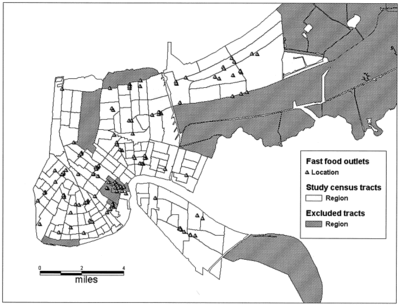
Richard A. Scribner Karen B.De , SalvoMD, MPH, MSc, Jason P.BlockMD, MPH carry out a research using GIS to study on the distribution of food outlets relative to the weight profile of the neighbourhood in New Orleans, Louisiana. Using the GIS software, the fast food outlets are geocoded and imported into the census tract map. The density is examined based on the 1mile and 0.5 miles buffer created on the map.
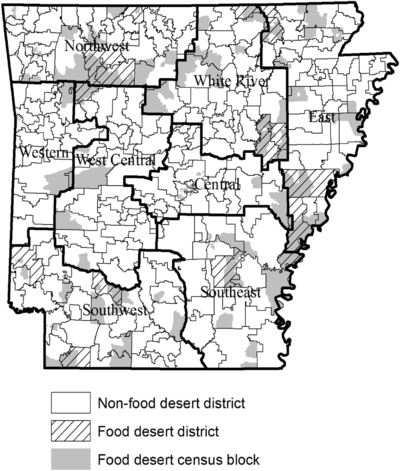
In ‘Food desert and childhood obesity’, Treuhaft S, Karpyn A. have used a combination of GIS and cluster analysis to determine the impact of food desert on obesity rates within the school district. The neighbourhood stores such as fast food restaurants is taken into measurement as well. ArcGIS is used for the measurement of the distance between each census block centroid to the nearest food stall. The Census Geographic Identifier (CGI) file was used to determine the location of the block centroid, whether is it in the urban or rural area and to determine the population within the block.
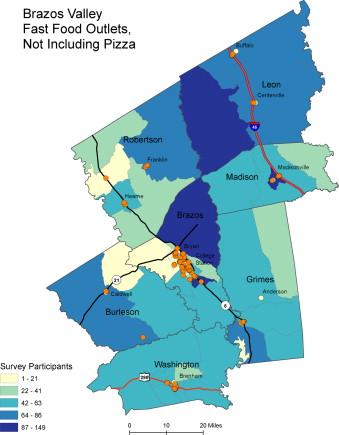
Richard A.Dunn, Joseph R.Sharkey and ScottHorel study the effect of the accessibility of fast food outlets on obesity risk among the residents of Central Texus using the GIS application. Various distances are calculated The addresses and positional coordinates of the food outlets were found in Brazos Valley Food Environment Project (BVFEP) and they are geocoded. GIS is used to calculate the distance between the residents’ home addresses and nearest intersection of major roadways.
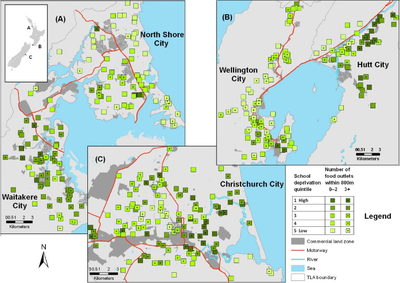
Peter L.Day and Jamie Pearce examine the degree of spatial clustering in proximity to schools . Spatstat package in R is used to measure the spatial point patterns. Using ArcGIS, the address of the fast food outlets and the schools are geocoded. A 400m and 800m buffer is created to measure the proportion of fast-food outlets located near the school with an estimated walking time of 5 and 10 minutes.
Nicolas M. Oreskovic, MD, MPH, Jonathan P. Winickoff, MD, MPH, Karen A. Kuhlthau, PhD, Diane Romm, PhD, and James M. Perrin, MD study the relationship between BMI of the children (8 to 12 years old) and the built environment using the GIS programming. The factors that are measure in a built environment include distance to schools, subway stations and fast food restaurants. The GIS application used is ArcMap version 9.2.. Home addresses of the childrens are geocoded and census data are downloaded and compiled. Density of the food outlets and other facilities is calculated based on the 400m buffer zones since it is since as a 5 minute walking distance.
IV. Approach
The models our group has taken is the Kernel Density Estimation. In doing so, we also had to acquire knowledge on spatial point analysis.
The main aim of AccessKnight is to allow users to investigate the risks involved among primary, secondary and junior college students [5]. AccessKnight uses the Kernel Density Estimation (KDE) which allows users to visualise clustering patterns using a defined search radius.
We collated a list of fast food restaurants and its address using Google Maps [6]. The fast food restaurants are namely:
1. Each a cup
2. KFC
3. McDonald
4. Subway
5. Long John Silver
6. Burger King
7. Pizza Hut
8. Gong Cha
9. Koi
10. Liho
11. 7 Eleven
12. Old Chang Kee
13. Subway
14. Popeyes
15. 4 Fingers
16. Carl's Jr
17. MOS Burger
18. Texas Chicken
19. Long John Silver
20. Arnold's Fried Chicken
21. Nene Chicken
22. Chic-a-Boo
23. The Handburger
24. Burger Up
The list of fast food is mainly grouped into 2 – Western Fast Food and Asian Milk Tea Brands.
We combined both sets of data – list of schools and Fast Food restaurants – and retrieved its longitude and latitudes coordinates using Tableau.
Before working on the application, we used RStudio software to test the codes.
The application was done mainly using the following code:
V. Results
How the geospatial analytics tool developed help to discover new understanding from the data.
The brighter spots are areas with higher concentration of fast food around schools. The central region has the largest concentration. Playing with the kernel density bandwidth, the figures show a range from 100 to 1000.
Users of the application will be able to analyse concentration of fast food nearby schools. Knowing the hotspots, users can better identify the schools whose students have too many fast food choices nearby, which may pose health issues. AccessKnight allows users to:
Select the primary school, secondary, junior college level and fast food outlets.
Toggle the distance of Kernel density
Users to examine the concentration of fast food around school locations
V. Discussion
What has the audience learned from your work? What new insights or practices has your system enabled? A full blown user study is not expected, but informal observations of use that help evaluate your system are encouraged.
VII. Future Work
In the future, AccessKnight aims to:
1. Allow users to select more than one cateogries to compare the risks among them
2. Integration with more data sites
3. Include multivariate Kernel Density Estimation
VIII. Acknowledgement
The authors wish to thank Dr Kam Tin Seong at Singapore Management University for his kind support and guidance in this project.
References
[1] American Journal of Preventive Medicine. Volume 27, Issue 3, October 2004, Pages 211-217. Fast food, race/ethnicity, and income: A geographic analysis. Jason P. Block, MPH, Richard A. Scribner MD, MPH, Karen B. DeSalvo MD, MPH, MSC, 2004
[2] Oxford Academic. Applied Economic Perspectives and Policy. Volume 35, Issue 1, 1 March 2013 Pages 106-124. Food Deserts and Childhood Obesity. Pedro A. Alviola, IV, Rodolfo M. Nayga, Jr., Michael Thomsen
[3] Economics & Human Biology Volume 10, Issue 1, January 2012, Pages 1-13. The effect of fast-food availability on fast-food consumption and obesity among rural residents: An analysis by race/ethnicity. Richard A.Dunn, Joseph R. Sharkey, ScottHorel
[4] Clinical Pediatrics. Obesity and the Built Environment Among Massachusetts Children. July 2009. Nicholas M Oreskovic, Jonathan P Winickoff, Karen A Kuhlthau, Diane Romm
[5] School directory and information in Excel format. Retrieved from https://data.gov.sg/dataset/school-directory-and-information
[6] Fast Food Restaurant database in CSV format. Retrieved from Google Map
