Difference between revisions of "Roadrunners Proposal"
Wlgwee.2015 (talk | contribs) |
Wlgwee.2015 (talk | contribs) |
||
| Line 26: | Line 26: | ||
<br/> | <br/> | ||
| − | <font face="Avenir"><big>Interim presentation slides: [[ | + | <font face="Avenir"><big>Interim presentation slides: [[Roadrunners Interim.pdf]]</big></font> |
<br/><br/> | <br/><br/> | ||
Revision as of 16:50, 11 March 2018
Interim presentation slides: Roadrunners Interim.pdf
While ITS aims to provide a safer experience for motorists, there is currently no known system in place to analyze the occurrence of traffic accidents. Traffic accidents are inevitable in any country and Singapore is no exception. They pose a huge problem to the safety of road users as they often result in fatalities and injuries. Therefore, our group aims to analyse the patterns of traffic accidents in Singapore and provide recommendations to reduce the occurence of traffic accidents in Singapore.
- Detect patterns of traffic incidents in Singapore and identify potential accident hotspots
- Analyse potential causes of traffic incidents in Singapore
- Analyse traffic-related issues such as heavy congestions or roadworks
- Evaluate the effectiveness of accident prevention measures implemented by LTA
- Possible recommendations to LTA to further reduce traffic incidents
| Data | Source | Data Type/Method | |
|---|---|---|---|
| Road Network | OpenStreet Map | Example | |
| LTA Road Camera | data.gov.sg | SHP | |
| Singapore Police Force Digital Traffic Red Light Cameras | data.gov.sg | SHP | |
| Singapore Police Force Digital Speed Enforcement Cameras | data.gov.sg | SHP | |
| MCE KPE Speed Camera | data.gov.sg | SHP | |
| Singapore Police Force Mobile Speed Cameras | data.gov.sg | SHP | |
| Singapore Police Force Police Speed Laser Cameras | data.gov.sg | SHP | |
| Singapore Police Force Fixed Speed Cameras | data.gov.sg | SHP | |
| Bollard | data.gov.sg | SHP | |
| Convex Mirror | mytransport.sg | SHP | |
| ERP Gantry | mytransport.sg | SHP | |
| Lamp Post | mytransport.sg | SHP | |
| Road Crossing | mytransport.sg | SHP | |
| Speed Regulating Strip | mytransport.sg | SHP | |
| Guard Rail | mytransport.sg | SHP | |
| Railing | mytransport.sg | SHP | |
| Road Hump | mytransport.sg | SHP | |
| Traffic Light | mytransport.sg | SHP | |
| Traffic Sign | mytransport.sg | SHP | |
| Word Marking | mytransport.sg | SHP | |
| Accident | mytransport.sg | API → JSON → CSV Script to call API periodically to retrieve JSON file. Script converts JSON to CSV file. Attributes: Type::String Latitude::double Longitude::double Message::String | |
| Heavy Traffic | mytransport.sg | ||
| Key Challenges | Description | Solution | |
|---|---|---|---|
| 1. | Lack of readily available data | There is currently no known data source that provides historical traffic accidents data in Singapore. There is only a real time API of traffic accidents from LTA. |
|
| 2. | Unfamiliarity with R Shiny | We are unfamiliar with R programming language due to the lack of prior experience |
|
| 3. | Unfamiliarity with spatial analysis techniques | We are unsure what spatial analysis techniques to use and how to apply it as we lack prior experience in geospatial analysis |
|
To gain a better understanding of how we could proceed with our analysis, we decided to conduct a literature review. Here are the summaries of some research paper on spatial analysis of traffic accidents:
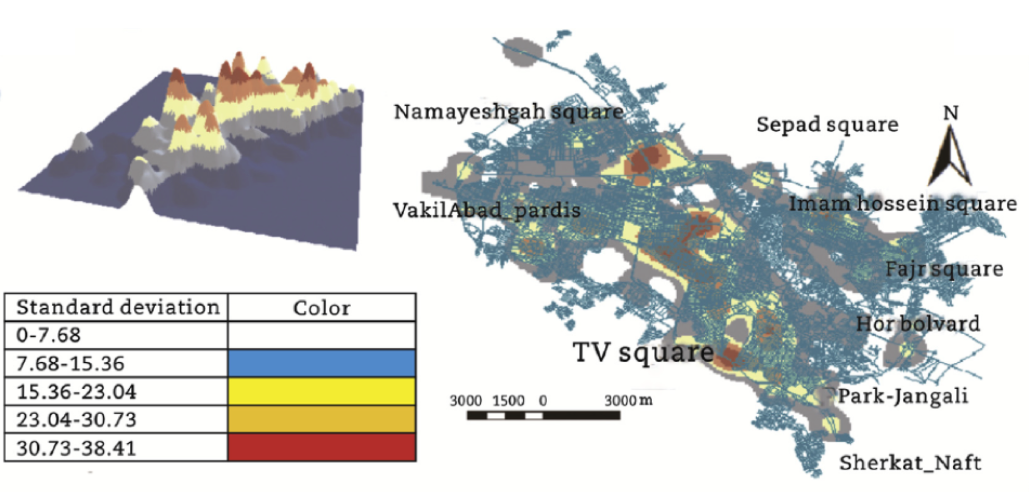
Aim of study: to use geographic information technology (GIS) and spatial-statistical analysis to gain insights of the traffic accident patterns in Mashhad, Iran.
Methodology:
1. Kernel Density Estimation
- To determine static hotspots
2. Nearest Neighbour Distance Analysis
- Used to determine if the accidents are clustered based on the nearest distance between two neighbouring accident points
3. K-function output analysis
- Used to provide a more accurate analysis of points distribution
Learning Points:
1. Spatial Analysis Techniques
- This study is similar to our project. Hence, we can learn the analysis technique they have used and apply it to our study
- Similarly, we can use Kernel Density Estimation to detect traffic accident hotspots and Nearest Neighbour K function to determine if the accidents are randomly distributed or clustered
Areas for improvement:
1. Hard to follow up
- As this analysis is done on a proprietary software (Arcview), it is impossible to reproduce the same study done by the researchers. Thus, it is hard for other researchers to follow up on their study.
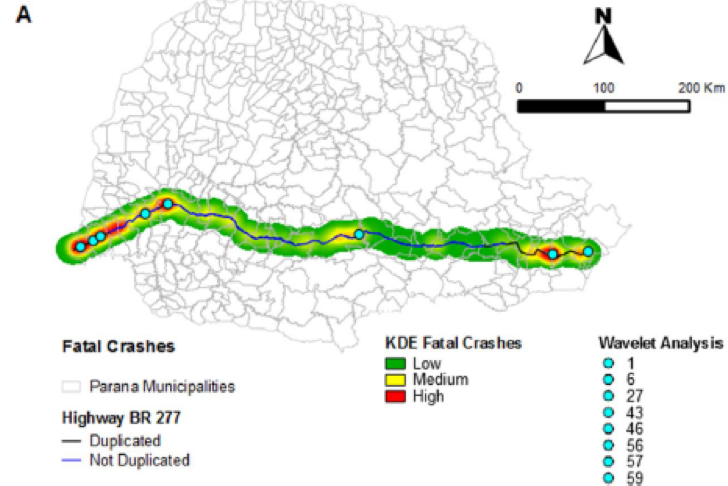
Aim of study: to analyse road traffic accidents hotspots in BR 277 highway located in the state of Parana, southern Brazil and performed environmental analysis to identify patterns contributing to the traffic accidents.
Methodology:
1. Kernel Density Estimation
- To determine accident hotspots
2. Wavelet
- Complement Kernel exploratory analysis
3. K-function output analysis
- To reduce the variables into similar variance components
- Then developed regression models to evaluate the impact of built environmental components on fatal crashes
Learning Points:
1. Spatial Analysis Techniques
- Apart from using Kernel Density Estimation to develop hotspots as well as K function to determine complete spatial randomness like the previous study, this research also explores the impact of how the human built environment affects the occurrence of accidents.
- We could possibly learn from this project how the built environment analysis is being executed and then determine how various infrastructures on the road affects the occurrence of accidents.
Areas for improvement:
1. Hard to follow up
- Similar to the previous study, this analysis is done on a proprietary software (QGIS), it is impossible to reproduce the same study done by the researchers. Thus, it is hard for other researchers to follow up on their study.
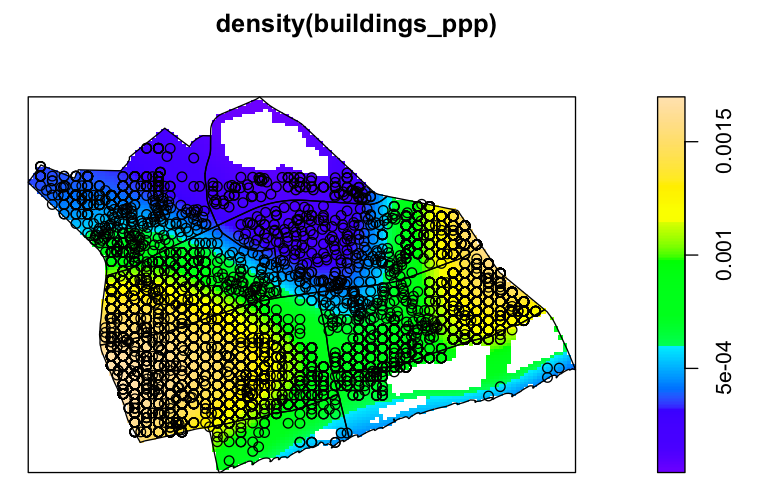
Aim of study: to analyse the distribution of GP Clinics, Preschools and Bus Stops in Bedok and provide recommendation on how amenities could be better planned.
Methodology:
1. Nearest Neighbour Index
- lpp function – to measure distance between points along a linear network
2. K-function
- To determine the clustering type
Learning Points:
1. Clear and easy to understand
- U San offered a very clear and easy to understand explanation of how Nearest Neighbour Index and K function works. This helped us significantly in understanding how these techniques are used in the other research papers.
- U San’s work was well documented. She clearly explained the step by step procedure of how he obtained her results as well as the R functions used for analysis. This makes it much easier for other researchers to reproduce a similar study.
- To analyse the spatial distribution of bus stops, U San included a road network constraint in the various analysis. This is done because bus stops can only occur on road networks. Similar to our study, accidents can only occur on road networks. Thus the road network constraint should be included in our analysis or else our result will not make sense.
Areas for improvement:
1. Sharing of codes
- U San did well in documenting her step by step procedure, teaching other researchers to know how to reproduce a similar study. However, it will be even better if U San could share a R notebook of her codes so that researchers could reproduce the exact same study and continue her research from where she stopped.
|
No. |
Name |
Date |
Comments |
|
1. |
Insert your Name here |
Insert Date here |
Insert Comment here |
|
2. |
Insert your Name here |
Insert Date here |
Insert Comment here |
|
3. |
Insert your Name here |
Insert Date here |
Insert Comment here |
