Difference between revisions of "Maptimization Details"
| Line 1: | Line 1: | ||
==Project Sketch== | ==Project Sketch== | ||
[[File:Maptimization_presketch.jpg|600px|frameless]]<br/> | [[File:Maptimization_presketch.jpg|600px|frameless]]<br/> | ||
| + | '''First sketch:''' </br> | ||
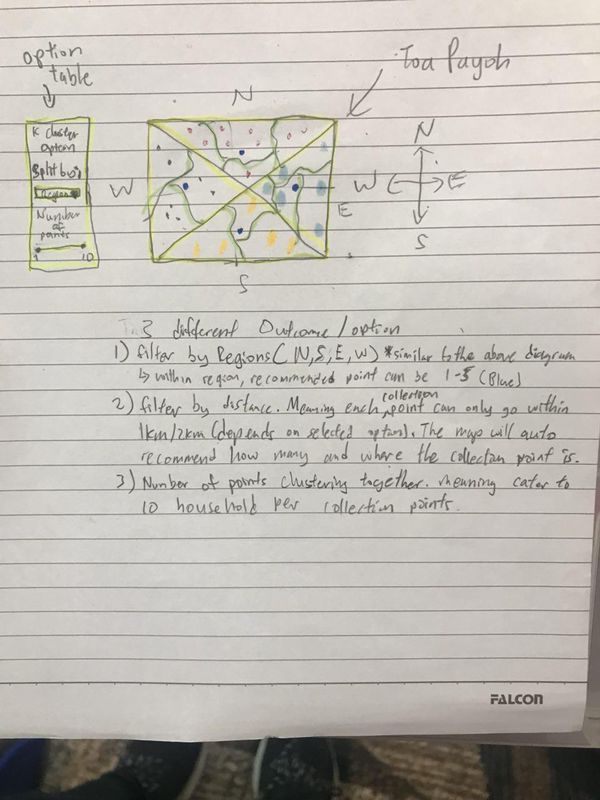
Our first sketch sets a direction of what we would like users to be able to see and utilize in our final application. As seen above, we would like to provide three features to our users | Our first sketch sets a direction of what we would like users to be able to see and utilize in our final application. As seen above, we would like to provide three features to our users | ||
<br/> | <br/> | ||
| Line 6: | Line 7: | ||
2. Filter by Distance: This means that each collection point can only go up to a certain range from them(e.g. 1KM away from them). The application would recommend how many collection points are within the selected range<br/> | 2. Filter by Distance: This means that each collection point can only go up to a certain range from them(e.g. 1KM away from them). The application would recommend how many collection points are within the selected range<br/> | ||
3. Filter by K-Clusters: This would allow users to know how many collection points are clustering together, as each collection point is catered to 10 household collection point. If a cluster is more dense, he will more likely be able to collect his laundry easier.<br/> | 3. Filter by K-Clusters: This would allow users to know how many collection points are clustering together, as each collection point is catered to 10 household collection point. If a cluster is more dense, he will more likely be able to collect his laundry easier.<br/> | ||
| + | |||
| + | |||
| + | '''Final sketch:''' </br> | ||
| + | [[File:Maptimization_sketch1.jpg|600px|frameless]]<br/> | ||
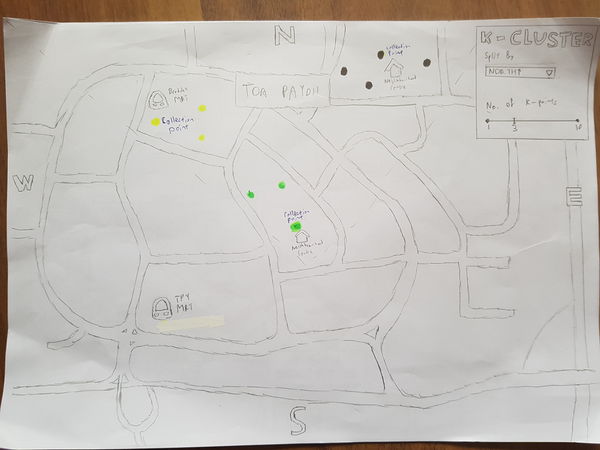
| + | Our final sketch shows an in-depth view of what we would expect the application to look and feel like. Through the selection of options on the top right of our application, users will be able to select Jelivery Service laundry collection points to their own convenience. <br/> | ||
| + | |||
| + | For illustration purposes, we have shown that a user have selected the "North" Region and a K-Cluster of 3. The application shows that 3 K-Clusters are shown to the user. The user will then be able to make their way down to whichever is the nearest collection point or whichever is the densest cluster to be served quicker. | ||
Revision as of 17:05, 30 March 2018
Project Sketch

First sketch:
Our first sketch sets a direction of what we would like users to be able to see and utilize in our final application. As seen above, we would like to provide three features to our users
1. Filtering by Region(North, South, East, West): This would allow users of different regions to only select laundry collection points near their regions. This is to facilitate convenience and disallow "noise(undesired)" collection points from showing up in their interface
2. Filter by Distance: This means that each collection point can only go up to a certain range from them(e.g. 1KM away from them). The application would recommend how many collection points are within the selected range
3. Filter by K-Clusters: This would allow users to know how many collection points are clustering together, as each collection point is catered to 10 household collection point. If a cluster is more dense, he will more likely be able to collect his laundry easier.
Final sketch:

Our final sketch shows an in-depth view of what we would expect the application to look and feel like. Through the selection of options on the top right of our application, users will be able to select Jelivery Service laundry collection points to their own convenience.
For illustration purposes, we have shown that a user have selected the "North" Region and a K-Cluster of 3. The application shows that 3 K-Clusters are shown to the user. The user will then be able to make their way down to whichever is the nearest collection point or whichever is the densest cluster to be served quicker.