Difference between revisions of "Centroid-Amenities Project Details"
| Line 77: | Line 77: | ||
<td> Singapore Residents by Subzone, Age Group and Sex, June 2016 (Gender) </td> | <td> Singapore Residents by Subzone, Age Group and Sex, June 2016 (Gender) </td> | ||
<td> https://data.gov.sg/dataset/singapore-residents-by-subzone-age-group-and-sex-june-2016-gender </td> | <td> https://data.gov.sg/dataset/singapore-residents-by-subzone-age-group-and-sex-june-2016-gender </td> | ||
| + | <td> SHP | ||
| + | </td></tr> | ||
| + | <tr> | ||
| + | <td> Pre-Schools Location </td> | ||
| + | <td> https://data.gov.sg/dataset/pre-schools-location </td> | ||
| + | <td> SHP | ||
| + | </td></tr> | ||
| + | <tr> | ||
| + | <td> Child Care Services </td> | ||
| + | <td> https://data.gov.sg/dataset/child-care-services?resource_id=195b6c5f-c277-4ba9-bcdc-25c264e3ee5c </td> | ||
<td> SHP | <td> SHP | ||
</td></tr> | </td></tr> | ||
Revision as of 19:23, 23 March 2018
Contents
Motivation and Problem Discovery
By 2030, Singapore’s Department of Statistics purports that nearly 1 in 3 Singaporeans will be over the age of 65, and will be in need of some form of eldercare. In the face on the oncoming ‘Silver Tsunami’, it is important that we rethink the placement and accessibility of our gerontological and palliative facilities, so Singaporeans can have access to the care that they need.
Many existing eldercare facilities are located in the fringes of new town suburbs, and often near regional hospitals which are often further and less accessible from residential areas where the elderly would be.
Our project posits that future eldercare facilities would be better positioned within the heartlands, to better serve an aging community. In this, we hope to equip town planners and eldercare facility administrators with the tools decide where best to place eldercare facilities.
Project Objectives
Our goals are :
- To build a GIS tool (an R Shiny app)
- Help administrators determine where best to put eldercare or any amenities
- Based on a geographical cluster analysis as determined through k-means clustering
Data Sources
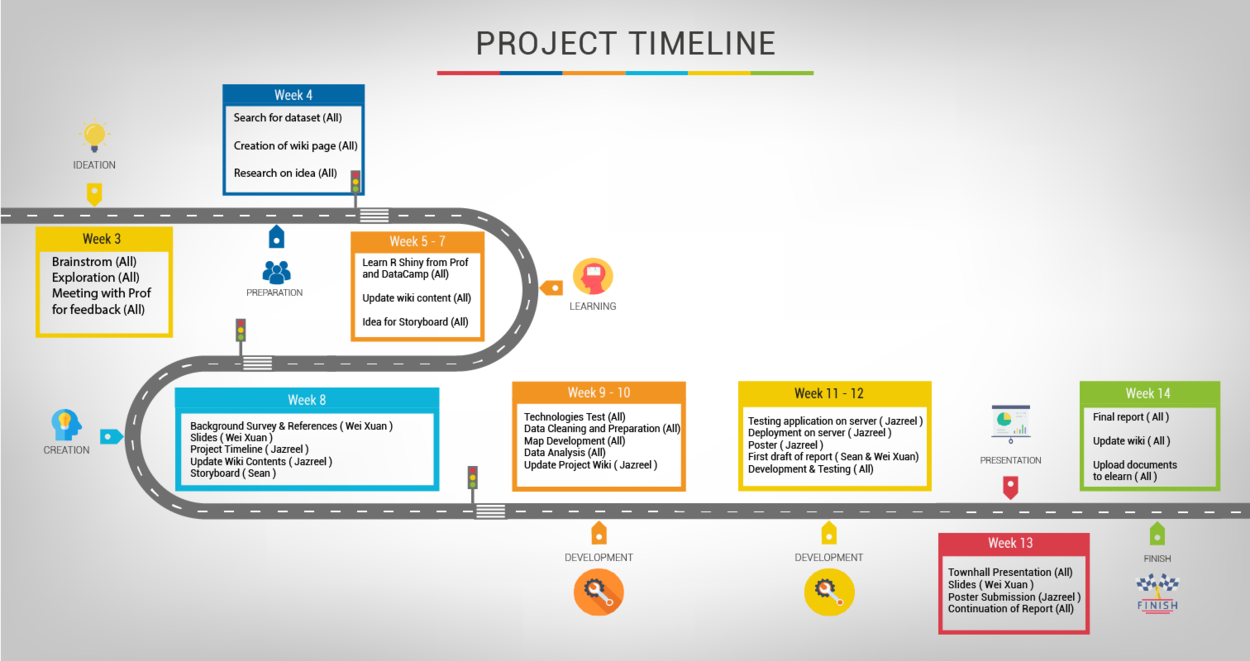
Project Timeline /Milestones
Related Work
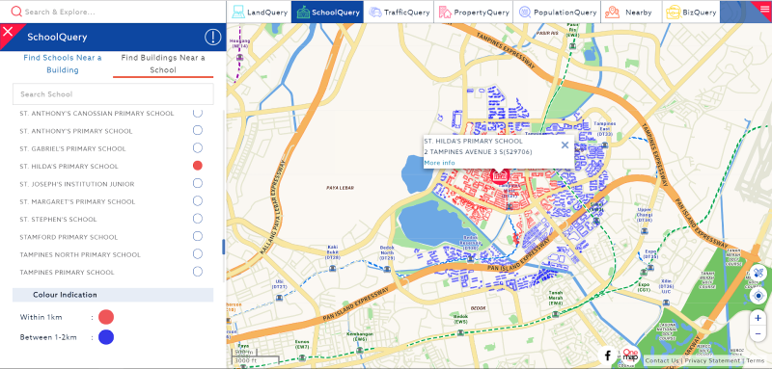
| OneMap SchoolQuery (https://www.onemap.sg/main/v2/schoolquery) |
| Using this as a reference for our user interface and functionalities of our application. |
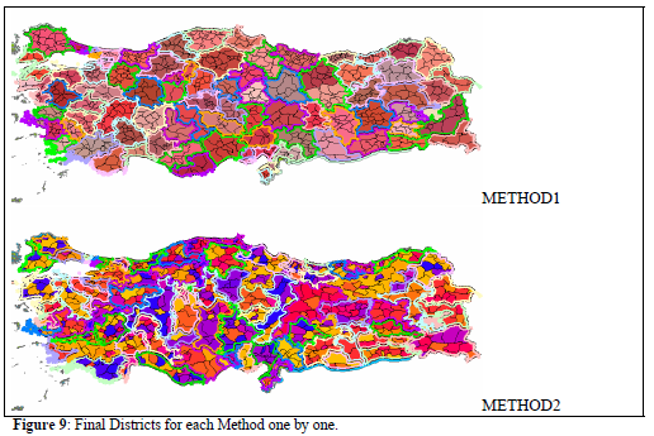
| Clustering With GIS: An Attempt to Classify Turkish District Data |
| Using this as a reference for the algorithm and analyze. |
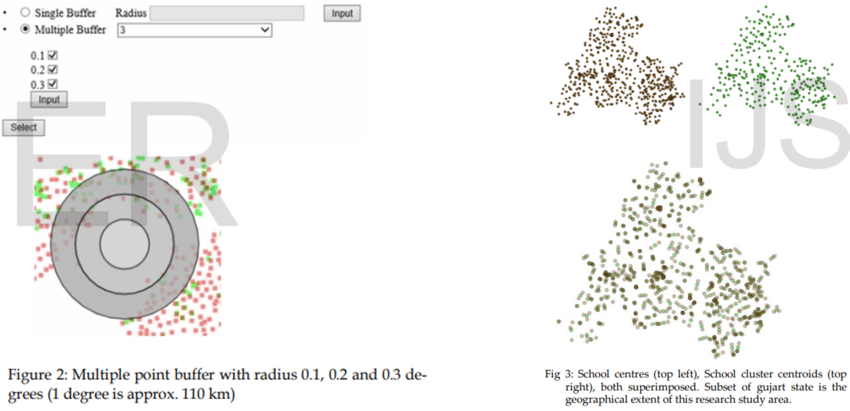
| Buffer Analysis and Modified K-Means Clustering for Geo-Spatial Amenities on Gujarat state |
| Using this as a reference for our k-means clustering. |
Challenges
Lack of Data
- Diffcult to find insightful data needed for the project
- Data found are not complete
Data cleaning and transformation
- Data found are not in the format that could be analysed, thus data cleaning is tough
- Documentation of cleaning process
Inexperience with QGIS
- Self-learning is required
- Listen to Prof Kam in class
- Peer-to-peer learning
Tools and Techologies
- QGIS
- Shiny
- R Language
- Open Street Map
- Mircosoft Excel
Meet The Team
References
Aksoy, Ece. (2006). Clustering With GIS: An Attempt to Classify Turkish District Data. Retrieved March 3, 2018, from https://www.researchgate.net/publication/255603804_Clustering_With_GIS_An_Attempt_to_Classify_Turkish_District_Data
Brajesh, S., Katyal, K., Pandya, M., Chaudhary, B., Bodar, H., Thakkar, P., Patel, L., Patel, N., Patel, K. (2014). Buffer Analysis and Modified K-Means Clustering for Geo-Spatial Amenities on Gujarat state. International Journal of Scientific & Engineering Research,5(8), 838-841. Retrieved March 3, 2018, from https://www.ijser.org/researchpaper/Buffer-Analysis-and-Modified-K-Means-Clustering-for-Geo-Spatial-Amenities-on-Gujarat-state.pdf
Tai, J., & Toh, Y. (2016, November 10). Growing old: Should you be worried? Retrieved March 04, 2018, from http://www.straitstimes.com/singapore/growing-old-should-you-be-worried
Comments
Hello fellow mates! Feel free to add your comments under this section. :)
