Difference between revisions of "Access-the-Excess Proposal"
| Line 146: | Line 146: | ||
<div style="background: #46566E; padding: 20px; line-height: 0.3em; text-indent: 16px;letter-spacing:0.1em;font-size:20px"><font color=#fbfcfd face="Arial Narrow">Project References to Related Work</font></div> | <div style="background: #46566E; padding: 20px; line-height: 0.3em; text-indent: 16px;letter-spacing:0.1em;font-size:20px"><font color=#fbfcfd face="Arial Narrow">Project References to Related Work</font></div> | ||
<div style="margin:0px; padding: 10px; background: #f2f4f4; font-family: Arial Narrow; border-radius: 7px; text-align:left"> | <div style="margin:0px; padding: 10px; background: #f2f4f4; font-family: Arial Narrow; border-radius: 7px; text-align:left"> | ||
| − | <b>The team has conducted a literature review to help us understand our project better. The following are the related | + | <b>The team has conducted a literature review to help us understand our project better. The following are the related work that we have studied.</b><br><br> |
The development of public health GIS applications, which include those that deals with obesity have increased over the years due to wide availability of geocoded location and health data which makes the use of GIS in public heath more sophisticated. | The development of public health GIS applications, which include those that deals with obesity have increased over the years due to wide availability of geocoded location and health data which makes the use of GIS in public heath more sophisticated. | ||
<br> | <br> | ||
| Line 164: | Line 164: | ||
[[Image: r5.png|center|400px]] | [[Image: r5.png|center|400px]] | ||
<br> | <br> | ||
| − | <b>From the literature review, the team has | + | <b>From the literature review, the team has generated the composite trade area of fast food place and schools, using Qgis.</b><br> |
| − | [[Image: mapFastFood.jpg|center| | + | [[Image: mapFastFood.jpg|center|800px]] |
<b>References</b><br> | <b>References</b><br> | ||
https://www-sciencedirect-com.libproxy1.nus.edu.sg/science/article/pii/S0749379704001394<br> | https://www-sciencedirect-com.libproxy1.nus.edu.sg/science/article/pii/S0749379704001394<br> | ||
Revision as of 00:28, 8 March 2018
|
No. |
Key Challenges |
Description |
Solution |
|
1. |
Difficulties faced in finding readily available data |
There is no data available from data.gov on the locations of Western Fast Food Restaurants |
•Obtain the postal codes of the Western Fast Food Restaurants from Google Maps and list them down into the Excel file |
|
2. |
Unfamiliar with R Shiny |
The team is completely new to R programming language |
•Independent learning starting from Iteration 1.4, Week 5 |
|
3. |
Unfamiliarity with spatial analysis techniques and difficulties faced during application |
The team is completely new to Geospatial Analysis |
•Independent learning |
|
4. |
Differing interpretations of project requirements |
The team may have faced misunderstandings on the requirements of the project |
•Internal meetings |
|
No. |
Title |
Format |
Website Link |
|
1. |
Master Plan 2014 Region Boundary (Web) |
KML/SHP |
https://data.gov.sg/dataset/master-plan-2014-region-boundary-web |
|
2. |
Coastal Outline |
KML/SHP |
From Prof Kam |
|
3. |
Education |
KML/SHP |
From Prof Kam |
|
4. |
Fast Food Restaurant |
CSV |
Google Map |
The team has conducted a literature review to help us understand our project better. The following are the related work that we have studied.
The development of public health GIS applications, which include those that deals with obesity have increased over the years due to wide availability of geocoded location and health data which makes the use of GIS in public heath more sophisticated.
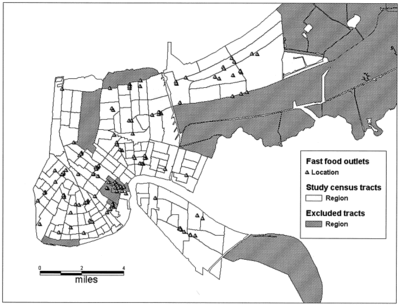
Richard A. Scribner Karen B.De , SalvoMD, MPH, MSc, Jason P.BlockMD, MPH carry out a research using GIS to study on the distribution of food outlets relative to the weight profile of the neighbourhood in New Orleans, Louisiana. Using the GIS software, the fast food outlets are geocoded and imported into the census tract map. The density is examined based on the 1mile and 0.5 miles buffer created on the map.
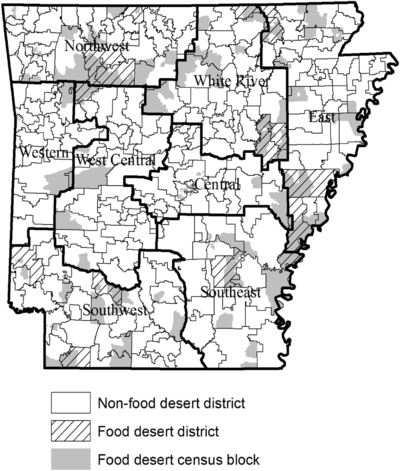
In ‘Food desert and childhood obesity’, Treuhaft S, Karpyn A. have used a combination of GIS and cluster analysis to determine the impact of food desert on obesity rates within the school district. The neighbourhood stores such as fast food restaurants is taken into measurement as well. ArcGIS is used for the measurement of the distance between each census block centroid to the nearest food stall. The Census Geographic Identifier (CGI) file was used to determine the location of the block centroid, whether is it in the urban or rural area and to determine the population within the block.
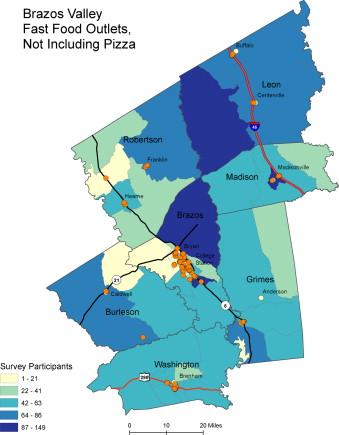
Richard A.Dunn, Joseph R.Sharkey and ScottHorel study the effect of the accessibility of fast food outlets on obesity risk among the residents of Central Texus using the GIS application. Various distances are calculated The addresses and positional coordinates of the food outlets were found in Brazos Valley Food Environment Project (BVFEP) and they are geocoded. GIS is used to calculate the distance between the residents’ home addresses and nearest intersection of major roadways.
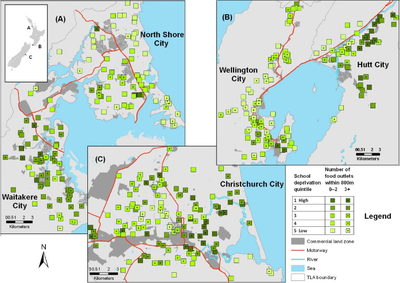
Peter L.Day and Jamie Pearce examine the degree of spatial clustering in proximity to schools . Spatstat package in R is used to measure the spatial point patterns. Using ArcGIS, the address of the fast food outlets and the schools are geocoded. A 400m and 800m buffer is created to measure the proportion of fast-food outlets located near the school with an estimated walking time of 5 and 10 minutes.
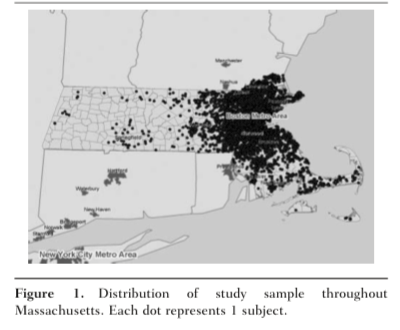
Nicolas M. Oreskovic, MD, MPH, Jonathan P. Winickoff, MD, MPH, Karen A. Kuhlthau, PhD, Diane Romm, PhD, and James M. Perrin, MD study the relationship between BMI of the children (8 to 12 years old) and the built environment using the GIS programming. The factors that are measure in a built environment include distance to schools, subway stations and fast food restaurants. The GIS application used is ArcMap version 9.2.. Home addresses of the childrens are geocoded and census data are downloaded and compiled. Density of the food outlets and other facilities is calculated based on the 400m buffer zones since it is since as a 5 minute walking distance.
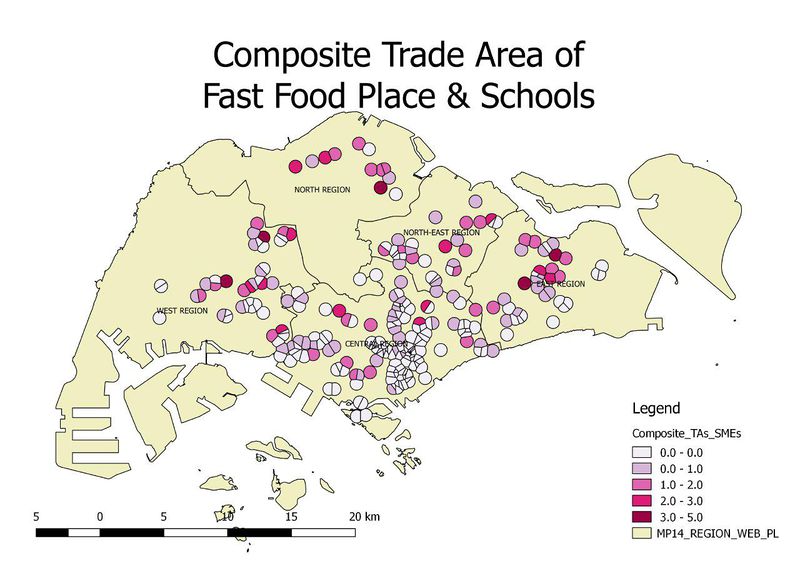
From the literature review, the team has generated the composite trade area of fast food place and schools, using Qgis.
References
https://www-sciencedirect-com.libproxy1.nus.edu.sg/science/article/pii/S0749379704001394
http://bb2sz3ek3z.search.serialssolutions.com/?sid=google&auinit=PA&aulast=Alviola+IV&atitle=Food+deserts+and+childhood+obesity&id=doi:10.1093/aepp/pps035&title=Applied+economic+perspectives+and+policy&volume=35&issue=1&date=2012&spage=106&issn=2040-5790
https://www-sciencedirect-com.libproxy1.nus.edu.sg/science/article/pii/S1570677X11000967?_rdoc=1&_fmt=high&_origin=gateway&_docanchor=&md5=b8429449ccfc9c30159a5f9aeaa92ffb
https://www.researchgate.net/profile/Karen_Kuhlthau/publication/26258534_Obesity_and_the_Built_Environment_Among_Massachusetts_Children/links/55d3474c08ae0a3417226323/Obesity-and-the-Built-Environment-Among-Massachusetts-Children.pdf
We appreciate your comments. Thanks for helping us improve!
|
No. |
Name |
Date |
Comments |
|
1. |
Insert Name |
Insert Date |
Insert Comment |
|
2. |
Insert Name |
Insert Date |
Insert Comment |
|
3. |
Insert Name |
Insert Date |
Insert Comment |

