Difference between revisions of "1718t2is415T2 G11 ProjectDetails"
Aliyahj.2014 (talk | contribs) |
Aliyahj.2014 (talk | contribs) |
||
| (21 intermediate revisions by the same user not shown) | |||
| Line 38: | Line 38: | ||
{| class="wikitable" style="background-color:#FFFFFF;" width="100%" | {| class="wikitable" style="background-color:#FFFFFF;" width="100%" | ||
<div style="margin:0px; padding: 10px; background: #f2f4f4; font-family: Open Sans, calibri, sans-serif;font-size:15px; border-radius: 7px; text-align:left"> | <div style="margin:0px; padding: 10px; background: #f2f4f4; font-family: Open Sans, calibri, sans-serif;font-size:15px; border-radius: 7px; text-align:left"> | ||
| − | Currently, there is a need to upgrade the living conditions in | + | Currently, there is a need to upgrade the living conditions in various parts of Myanmar. However, it is difficult to identify the locations of the areas that are in need of basic infrastructure, in terms of transportation, environment conditions and info communications sectors as well as human development and health care sectors. The lack of visibility in deciding which area needs more assistance is the prime motivating factor for our team to take up on the project. Through our application, we hope to seek attention from international organizations to provide assistance for those identified areas in any possible means. |
</div> | </div> | ||
| + | |||
| + | |||
<div style="background:#333; padding: 10px; margin:0px; line-height: 0.8em; text-indent: 15px; font-size:18px;font-family:tahoma;"><font color= #FFFFFF>Project Objectives</font></div> | <div style="background:#333; padding: 10px; margin:0px; line-height: 0.8em; text-indent: 15px; font-size:18px;font-family:tahoma;"><font color= #FFFFFF>Project Objectives</font></div> | ||
<div style="margin:0px; padding: 10px; background: #f2f4f4; font-family: Open Sans, calibri, sans-serif;font-size:15px; border-radius: 7px; text-align:left"> | <div style="margin:0px; padding: 10px; background: #f2f4f4; font-family: Open Sans, calibri, sans-serif;font-size:15px; border-radius: 7px; text-align:left"> | ||
| − | + | Through our project, we aim to : <br> | |
| + | • Identify the areas with infrastructure and development needs<br> | ||
| + | • Analyze and highlight the regions with infrastructure and development needs<br> | ||
| + | • Allow discernibility of distribution map based on dynamic input parameters<br> | ||
| + | • Identify any existing clusters having significantly less/better infrastructure<br> | ||
| + | • Indicate whether or not there is a substantial gap in infrastructure between regions<br> | ||
| + | • Project the ideas and insights derived to the department of rural and urban development for further execution<br> | ||
</div> | </div> | ||
| + | <div style="background:#333; padding: 10px; margin:0px; line-height: 0.8em; text-indent: 15px; font-size:18px;font-family:tahoma;"><font color= #FFFFFF>Project Prototype</font></div> | ||
| + | <div style="margin:0px; padding: 10px; background: #f2f4f4; font-family: Open Sans, calibri, sans-serif;font-size:15px; border-radius: 7px; text-align:left"> | ||
| + | |||
| + | Users interested in improving the infrastructure or other related social causes in Myanmar will be able to use our application to help them get a better understanding of which regions require need of help. Users can choose to display results nationwide or by a specific region, and the option is available in tab form. | ||
| + | |||
| + | If a user wishes to display results nationwide, they can select the 'Nationwide' tab and then select the sector that they are interested in helping, as well as which indicator(area of interest). They may also select the type of Spatial Neighbours Model they prefer. | ||
| + | |||
| + | The user can also make configurations to how the map should be displayed, such as | ||
| + | 1) changing the colour scheme | ||
| + | 2) choosing the classification method | ||
| + | 3) selecting the number of classes to display | ||
| + | 4) selecting the number of bins for the histogram | ||
| + | |||
| + | |||
| + | Upon selecting their desired dataset and settings, the results will be automatically generated. The user will be able to see the <b>spread of values over different regions throughout the whole of Myanmar</b> visualized by a choropleth map, accompanied by a histogram based on the filters selected. The user may then hover over any region and the name of the region as well as the values associated to it will appear. The LISA and Spatial Neighbour model map are also generated and the user may <b>observe the existence of clusters and determine if there exists uneven distribution between regions</b>. Below is a prototype of the UI if the user selects 'Information and Communication' as their sector and 'Number of Households which Have Landline Phone' as their area of interest: | ||
| + | |||
| + | |||
| + | [[File:Proto1.png|center|800px]] | ||
| + | |||
| + | |||
| + | Below is the list of sectors and area of interests that a user may select for the <b>nationwide tab</b>: | ||
| + | |||
| + | [[File:Sectorareaofinterest.png|center]] | ||
| + | |||
| + | The user is also available to see the <b> spread of values and clustering among townships in a region.</b> They can select the regions tab and select their area of interest and configure their map settings as in the nationwide tab.<br> | ||
| + | |||
| + | The following is a UI prototype for when the user selects the Kachin region: | ||
| + | |||
| + | |||
| + | [[File:Finalproto2.png|center|800px]] | ||
| + | |||
| + | The following are regions of Myanmar the user can select from: | ||
| + | [[File:Myanmar Regions.png|center]] | ||
| − | <div style="background:#333; padding: 10px; margin:0px; line-height: 0.8em; text-indent: 15px; font-size:18px;font-family:tahoma;"><font color= #FFFFFF>Project | + | Below is the list of sectors and area of interests that a user may select for the <b>region</b> tab: |
| + | |||
| + | [[File:Sectorareaofinterestregion.png|center]] | ||
| + | |||
| + | </div> | ||
| + | |||
| + | |||
| + | <div style="background:#333; padding: 10px; margin:0px; line-height: 0.8em; text-indent: 15px; font-size:18px;font-family:tahoma;"><font color= #FFFFFF>Project Milestones</font></div> | ||
<div style="margin:0px;background: #f2f4f4; padding: 10px; font-family: Open Sans, calibri, sans-serif;font-size:15px; border-radius: 7px; text-align:left"> | <div style="margin:0px;background: #f2f4f4; padding: 10px; font-family: Open Sans, calibri, sans-serif;font-size:15px; border-radius: 7px; text-align:left"> | ||
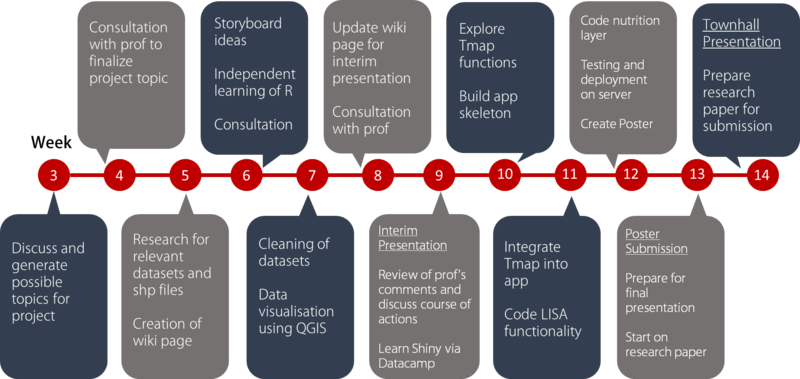
[[File:MILESTONES.png|center|800px]] | [[File:MILESTONES.png|center|800px]] | ||
| Line 61: | Line 109: | ||
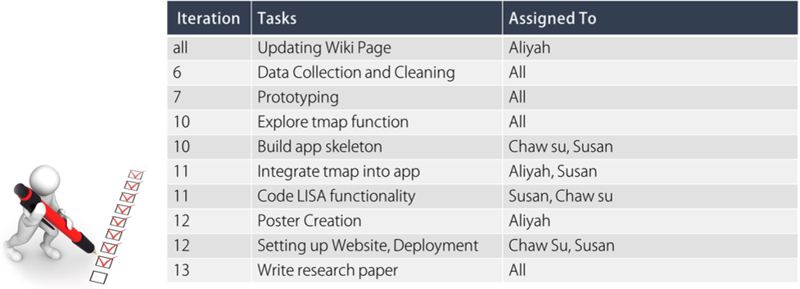
<div style="background:#333; padding: 10px; margin:0px; line-height: 0.8em; text-indent: 15px; font-size:18px;font-family:tahoma;"><font color= #FFFFFF>Allocation of Tasks</font></div> | <div style="background:#333; padding: 10px; margin:0px; line-height: 0.8em; text-indent: 15px; font-size:18px;font-family:tahoma;"><font color= #FFFFFF>Allocation of Tasks</font></div> | ||
<div style="margin:0px; padding: 50px; font-family: Open Sans, calibri, sans-serif;font-size:15px; border-radius: 7px; text-align:left"> | <div style="margin:0px; padding: 50px; font-family: Open Sans, calibri, sans-serif;font-size:15px; border-radius: 7px; text-align:left"> | ||
| − | [[File:Tasks.png | + | [[File:Tasks.png|800px]] |
</div> | </div> | ||
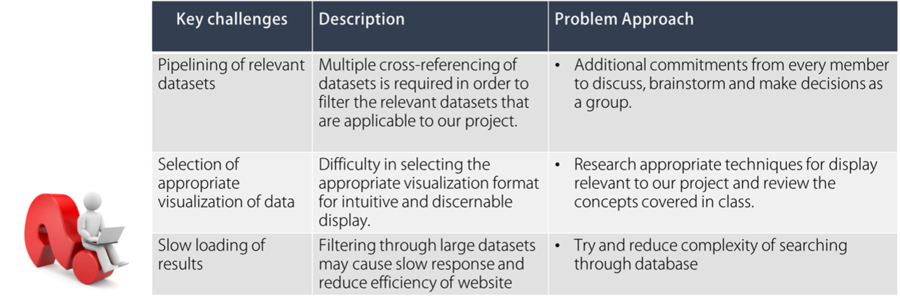
| + | <div style="background:#333; padding: 10px; margin:0px; line-height: 0.8em; text-indent: 15px; font-size:18px;font-family:tahoma;"><font color= #FFFFFF>Key Challenges</font></div> | ||
| + | <div style="margin:0px; padding: 50px; font-family: Open Sans, calibri, sans-serif;font-size:15px; border-radius: 7px; text-align:left"> | ||
| + | [[File:Key challenges.png|900px]] | ||
| + | </div> | ||
| Line 70: | Line 122: | ||
<div style="margin:0px; padding: 10px; background: #f2f4f4; font-family: Open Sans, calibri, sans-serif;font-size:15px; border-radius: 7px; text-align:left"> | <div style="margin:0px; padding: 10px; background: #f2f4f4; font-family: Open Sans, calibri, sans-serif;font-size:15px; border-radius: 7px; text-align:left"> | ||
Our data-sets come from [http://www.themimu.info/ Myanmar Information Management Unit(MIMU)]. | Our data-sets come from [http://www.themimu.info/ Myanmar Information Management Unit(MIMU)]. | ||
| + | |||
| + | {| class="wikitable" style="background-color:#f2f4f4;font-family:tahoma font-size:15px" width="100%" | ||
| + | |- | ||
| + | | | ||
| + | <b>No.</b> | ||
| + | || | ||
| + | <b>Name</b> | ||
| + | || | ||
| + | <b>Type of File</b> | ||
| + | |- | ||
| + | | | ||
| + | 1. | ||
| + | || | ||
| + | [http://geonode.themimu.info/layers/geonode%3Amyanmar_state_region_boundaries Myanmar State Region Boundaries] | ||
| + | || | ||
| + | SHP file | ||
| + | |- | ||
| + | | | ||
| + | 2. | ||
| + | || | ||
| + | [http://geonode.themimu.info/layers/geonode%3Amimu_township_boundary Myanmar Township Boundaries] | ||
| + | || | ||
| + | SHP File | ||
| + | |- | ||
| + | | | ||
| + | 3. | ||
| + | || | ||
| + | [http://themimu.info/sites/themimu.info/files/documents/MIMU_BaselineData_AllSectors_Countrywide_12Dec2017.xlsm Baseline Data for All Sectors] | ||
| + | || | ||
| + | CSV File | ||
| + | |- | ||
| + | |} | ||
</div> | </div> | ||
| + | |||
| + | |||
| + | |||
| + | |||
| + | <div style="background:#333; padding: 10px; margin:0px; line-height: 0.8em; text-indent: 15px; font-size:18px;font-family:tahoma;"><font color= #FFFFFF>Our Team</font></div> | ||
| + | |||
| + | <div style = "padding: 50px"> | ||
| + | [[File:Meetteam.png|center|800px]] | ||
| + | </div> | ||
| + | |||
| + | |||
Latest revision as of 20:41, 10 April 2018
Currently, there is a need to upgrade the living conditions in various parts of Myanmar. However, it is difficult to identify the locations of the areas that are in need of basic infrastructure, in terms of transportation, environment conditions and info communications sectors as well as human development and health care sectors. The lack of visibility in deciding which area needs more assistance is the prime motivating factor for our team to take up on the project. Through our application, we hope to seek attention from international organizations to provide assistance for those identified areas in any possible means.
Through our project, we aim to :
• Identify the areas with infrastructure and development needs
• Analyze and highlight the regions with infrastructure and development needs
• Allow discernibility of distribution map based on dynamic input parameters
• Identify any existing clusters having significantly less/better infrastructure
• Indicate whether or not there is a substantial gap in infrastructure between regions
• Project the ideas and insights derived to the department of rural and urban development for further execution
Users interested in improving the infrastructure or other related social causes in Myanmar will be able to use our application to help them get a better understanding of which regions require need of help. Users can choose to display results nationwide or by a specific region, and the option is available in tab form.
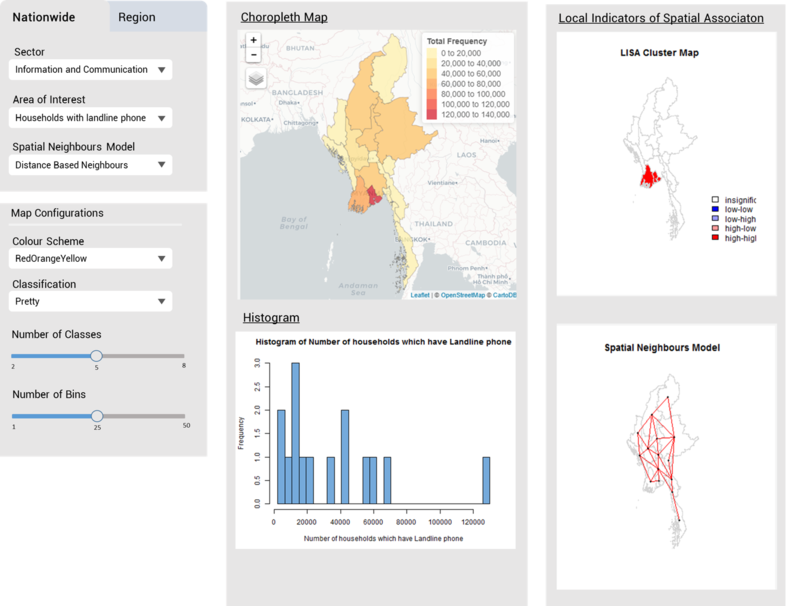
If a user wishes to display results nationwide, they can select the 'Nationwide' tab and then select the sector that they are interested in helping, as well as which indicator(area of interest). They may also select the type of Spatial Neighbours Model they prefer.
The user can also make configurations to how the map should be displayed, such as 1) changing the colour scheme 2) choosing the classification method 3) selecting the number of classes to display 4) selecting the number of bins for the histogram
Upon selecting their desired dataset and settings, the results will be automatically generated. The user will be able to see the spread of values over different regions throughout the whole of Myanmar visualized by a choropleth map, accompanied by a histogram based on the filters selected. The user may then hover over any region and the name of the region as well as the values associated to it will appear. The LISA and Spatial Neighbour model map are also generated and the user may observe the existence of clusters and determine if there exists uneven distribution between regions. Below is a prototype of the UI if the user selects 'Information and Communication' as their sector and 'Number of Households which Have Landline Phone' as their area of interest:
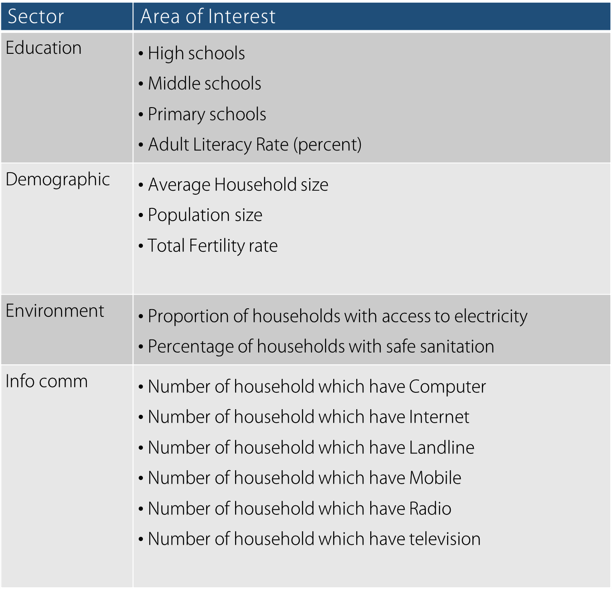
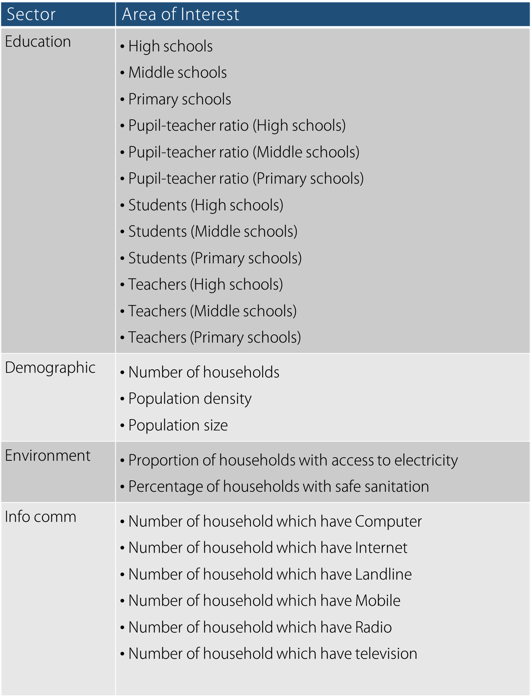
Below is the list of sectors and area of interests that a user may select for the nationwide tab:
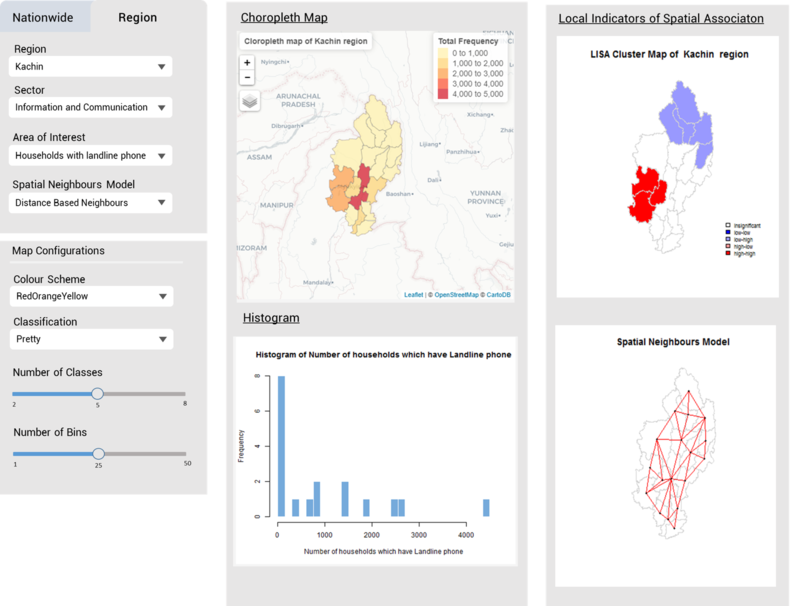
The user is also available to see the spread of values and clustering among townships in a region. They can select the regions tab and select their area of interest and configure their map settings as in the nationwide tab.
The following is a UI prototype for when the user selects the Kachin region:
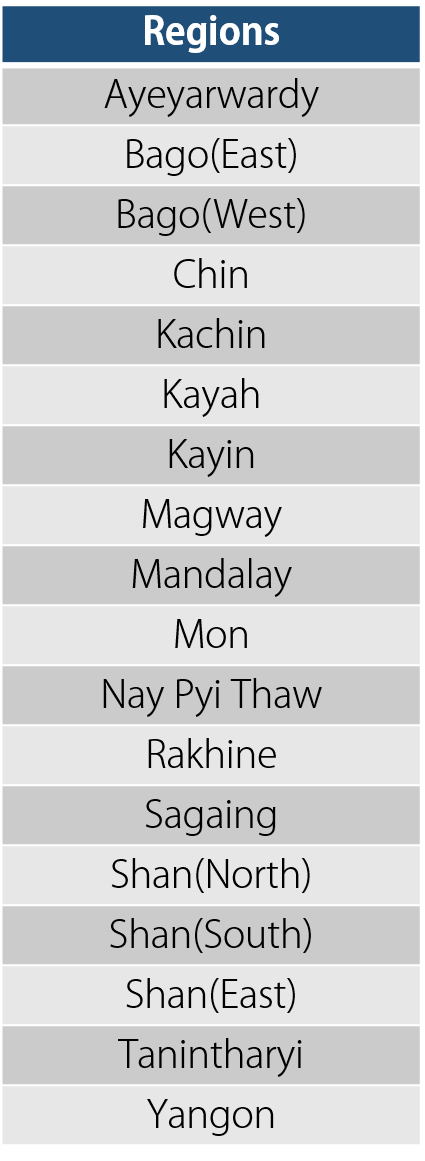
The following are regions of Myanmar the user can select from:
Below is the list of sectors and area of interests that a user may select for the region tab:
Our data-sets come from Myanmar Information Management Unit(MIMU).
|
No. |
Name |
Type of File |
|
1. |
SHP file | |
|
2. |
SHP File | |
|
3. |
CSV File |
Any comments will be greatly appreciated! :)
|
No. |
Name |
Date |
Comments |
|
1. |
Insert your Name here |
Insert Date here |
Insert Comment here |
|
2. |
Insert your Name here |
Insert Date here |
Insert Comment here |
|
3. |
Insert your Name here |
Insert Date here |
Insert Comment here |

