Difference between revisions of "RiskMappers Proposal"
Kyfan.2015 (talk | contribs) |
|||
| (57 intermediate revisions by one other user not shown) | |||
| Line 35: | Line 35: | ||
| | | | ||
<div style="padding: 17px"> | <div style="padding: 17px"> | ||
| − | [[File: | + | [[File:IS415-1819-RiskMappers-Technology-Proposal1.png|100px|center|Jury]] |
</div> | </div> | ||
| − | || | + | || |
| − | Risk | + | <b>Risk in Singapore</b><br> |
| + | Since 2014, Singapore has been striving to achieve the vision of being a smart nation. The most integral step in this direction is the analysis and assessment of risk, for it is only by doing so that we can build a healthy, safe and prepared smart nation. After all the steps taken by the Singaporean government and society to be more risk-free, it is important to understand our vulnerability - in terms of dominant contributing factors, location and key institutions that could potentially be affected by these risks. To address this, we identify the risks posed to a specific target group of the population, school students, so as to narrow our focus and understand these risks better. Additionally, we will analyse the public service infrastructure in place in terms of 24 hour response institutions. We demonstrate the potential of R shiny app using interactive map to explore and analyse both sides of vulnerability and preparedness with respect to risk. | ||
| + | |||
| + | Risk and hazard are terms commonly used to describe aspects of the potential for harm caused by environmental factors and other agents. In Singapore’s endeavour to be a healthy, safe and prepared smart nation, the most important age group of the population is of children - the future generations of our country. Children and teenagers aged 6 thru 16 are in the most susceptible and impressionable years of their life and therefore, it is important for us to better understand the vicinity of institutions that younger generations attend, the key ones being primary and secondary schools. This analysis will also help parents in choosing schools while being aware of the potential risks and vulnerabilities their children might be exposed to. For the sake of scope, we have restricted ourselves to three types of risks - health (tobacco and unhealthy eateries), entertainment (arcades) and terrorist (petrol stations, as a representative of the same). We then analyse the total number of risk factors to assign a risk score to each school that is later mapped out. | ||
| − | + | With the launch of SGSecure in 2016, it is evident that Singapore’s government has been taking emergency preparedness seriously. Therefore, the second part of our analysis, the response analysis is with regards to the key public service institutions that are expected to operate 24/7 and include emergency rooms in hospitals, fire stations and police stations. | |
| − | |||
| − | |||
| − | |||
|- | |- | ||
|} | |} | ||
| Line 55: | Line 55: | ||
<b>Geographical Risk Analysis</b> | <b>Geographical Risk Analysis</b> | ||
|| | || | ||
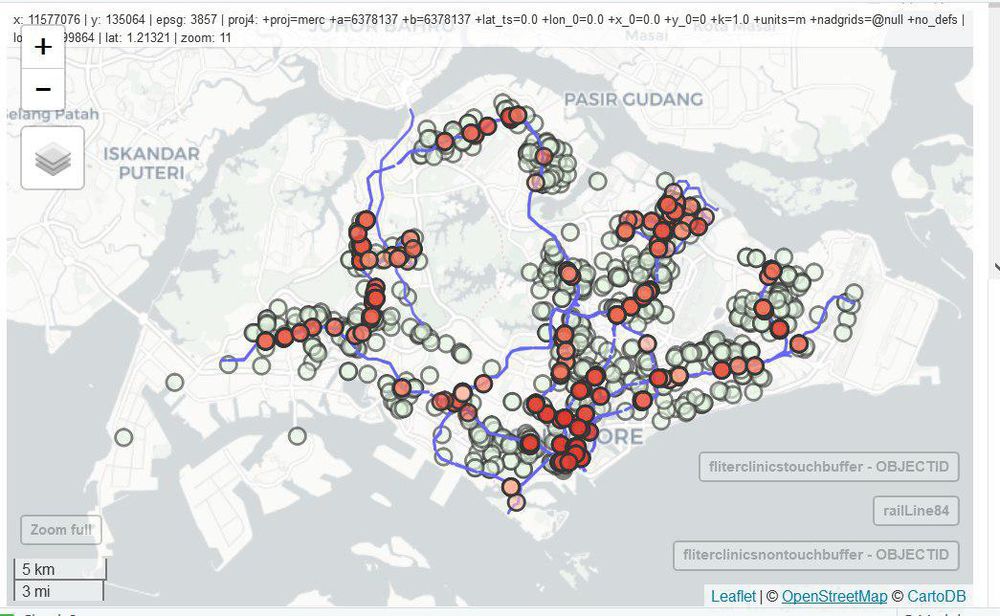
| − | Each layer represents a specific area of risk which certain institutions pose to | + | Each layer represents a specific area of risk which certain institutions pose to a student. By including each layer it allows users to visualize possible risks in each locale. |
| − | <br>Layers | + | <br>Layers |
| − | <br>- | + | <br>- Health Risk (Tobacco Store / Unhealthy Eatries) |
| − | <br>- | + | <br>- Terrorist Risk (Petrol Station) |
| − | <br>- | + | <br>- Entertainment Risk (Arcade) |
| − | |||
| − | |||
| − | |||
| − | |||
| − | |||
| − | |||
| − | |||
|- | |- | ||
| | | | ||
<b>Functionality</b> | <b>Functionality</b> | ||
| − | |||
|| | || | ||
| − | - Our visualization calculates the risk score based on | + | 1. Visual Risk Analysis<br><br> |
| − | <br>- Users will be able to view user selected locales "risk score" to determine how much risk is each area exposed to | + | - With our visualization, users will be able to determine the possible risk exposure in each school. |
| + | <br>- Upon adding layers the increased overlapping areas will increase in color intensity for the school. | ||
| + | <br>- The more saturated the color, the more risk exposed the school is. | ||
| + | <br><br> | ||
| + | 2. Statistical Risk Analysis<br><br> | ||
| + | - Our visualization calculates the risk score based on *distance of each locale* from a potential risk point. | ||
| + | <br>- Users will be able to view user selected locales "risk score" to determine how much risk is each area exposed to. | ||
|- | |- | ||
| | | | ||
<b>Usage</b> | <b>Usage</b> | ||
|| | || | ||
| − | Our visualization allows users to | + | Our visualization allows users to comprehend how much potential risk each area is exposed to. From this information, we hope to aid in Singapore's goals of Smart City planning to take into consideration not only ease of access to the population but also the risk different institutions pose to inhabitants. |
|- | |- | ||
|} | |} | ||
| − | <!-- END OF PROJECT | + | <!-- END OF PROJECT DIRECTION---> |
| Line 89: | Line 87: | ||
<div style="margin:0px; padding: 10px; background: #f2f4f4; font-family: Open Sans, Arial, sans-serif; border-radius: 7px; text-align:left"> | <div style="margin:0px; padding: 10px; background: #f2f4f4; font-family: Open Sans, Arial, sans-serif; border-radius: 7px; text-align:left"> | ||
| − | <b>1. Identify and highlight the institutions that conduct activities that pose risks to | + | {| class="wikitable" style="background-color:#FFFFFF;" width="100%" |
| − | + | |- | |
| − | < | + | | |
| + | <div style="padding: 17px"> | ||
| + | [[File:IS415-1819-RiskMappers-Technology-Proposal1.png|100px|center|Jury]] | ||
| + | </div> | ||
| + | || | ||
| + | <b>Issue 1</b><br> | ||
| + | 1. Identify and highlight the institutions that conduct activities that pose risks to schools and students<br> | ||
| + | 2. Analyse and evaluate the risk score of each school<br> | ||
| + | |- | ||
| + | | | ||
| + | <div style="padding: 17px"> | ||
| + | [[File:IS415-1819-RiskMappers-Technology-Proposal2.png|100px|center|Jury]] | ||
| + | </div> | ||
| + | || | ||
| + | <b>Issue 2</b><br> | ||
| + | 1. Identify and highlight the institutions that conduct activities that pose risks to society<br> | ||
| + | 2. Identify and highlight the institutions that could respond to these risks and their response limitations<br> | ||
| + | 3. Analyse and evaluate whether or not a risk can be responded to in a given time frame based on limitations such as coverage of response institutions<br> | ||
| + | |- | ||
| + | |} | ||
| + | |||
</div> | </div> | ||
| Line 98: | Line 116: | ||
<div style="background: #e58824; padding: 20px; line-height: 0.3em; text-indent: 16px;letter-spacing:0.1em;font-size:26px"><font color=#fbfcfd face="Bebas Neue">PROJECT DATA SOURCE</font></div> | <div style="background: #e58824; padding: 20px; line-height: 0.3em; text-indent: 16px;letter-spacing:0.1em;font-size:26px"><font color=#fbfcfd face="Bebas Neue">PROJECT DATA SOURCE</font></div> | ||
<div style="margin:0px; padding: 10px; background: #f2f4f4; font-family: Open Sans, Arial, sans-serif; border-radius: 7px; text-align:left"> | <div style="margin:0px; padding: 10px; background: #f2f4f4; font-family: Open Sans, Arial, sans-serif; border-radius: 7px; text-align:left"> | ||
| − | + | Our team's datasets are retrieved from <b>https://data.gov.sg</b><br> | |
{| class="wikitable" style="background-color:#FFFFFF;" width="100%" | {| class="wikitable" style="background-color:#FFFFFF;" width="100%" | ||
|- | |- | ||
| | | | ||
| − | + | <b>Title</b> | |
| − | || | + | || |
| − | + | <b>Format</b> | |
| − | + | || | |
| + | <b>Used for Issue 1 or 2</b> | ||
| + | || | ||
| + | <b>Website Link</b> | ||
| + | |- | ||
| + | | | ||
| + | Primary/Secondary School | ||
| + | || | ||
| + | CSV | ||
| + | || | ||
| + | Both Issue | ||
| + | || | ||
| + | https://docs.onemap.sg/#onemap-rest-apis | ||
|- | |- | ||
| − | | | + | | |
| − | + | Petrol Station | |
| − | || | + | || |
| − | https:// | + | Unformatted (format to csv) |
| + | || | ||
| + | Issue 1: Risk to Students | ||
| + | || | ||
| + | https://www.caltex.com/sg/find-a-caltex-station.html<br> | ||
| + | https://www.esso.com.sg/our-stations<br> | ||
| + | https://www.spc.com.sg/our-business/spc-service-station/station-locator<br> | ||
| + | https://www.shell.com.sg/motorists/shell-station-locator.html | ||
|- | |- | ||
| | | | ||
| − | + | Unhealthy Eateries | |
| − | || | + | || |
| − | https://data.gov.sg/dataset/ | + | KML |
| + | || | ||
| + | Issue 1: Risk to Students | ||
| + | || | ||
| + | https://data.gov.sg/dataset/healthier-eateries | ||
|- | |- | ||
| | | | ||
| − | + | Tobacco License | |
| − | || | + | || |
| − | https://data.gov.sg/dataset/ | + | CSV |
| + | || | ||
| + | Issue 1: Risk to Students | ||
| + | || | ||
| + | https://data.gov.sg/dataset/listing-of-licensed-tobacco-retailers | ||
|- | |- | ||
| | | | ||
| − | + | Acrades | |
| − | || | + | || |
| − | https:// | + | Unformatted (format to csv) |
| + | || | ||
| + | Issue 1: Risk to Students | ||
| + | || | ||
| + | http://www.streetdirectory.com/businessfinder/company_branch/157187/127270/<br> | ||
| + | https://www.yelp.com.sg/search?cflt=arcades&find_loc=Singapore<br> | ||
| + | http://www.timezone.com.sg/Location<br> | ||
|- | |- | ||
| | | | ||
| − | + | Hospital | |
| − | || | + | || |
| − | https:// | + | CSV |
| + | || | ||
| + | Issue 2: Response Time | ||
| + | || | ||
| + | https://docs.onemap.sg/#onemap-rest-apis | ||
|- | |- | ||
| | | | ||
| − | + | Police Station | |
| − | || | + | || |
| − | https:// | + | CSV |
| + | || | ||
| + | Issue 2: Response Time | ||
| + | || | ||
| + | https://docs.onemap.sg/#onemap-rest-apis | ||
|- | |- | ||
| | | | ||
| − | + | Fire Station | |
| − | || | + | || |
| − | + | CSV | |
| + | || | ||
| + | Issue 2: Response Time | ||
| + | || | ||
| + | https://docs.onemap.sg/#onemap-rest-apis | ||
|- | |- | ||
|} | |} | ||
| − | |||
</div> | </div> | ||
| Line 157: | Line 219: | ||
<!-- END OF TIMELINE---> | <!-- END OF TIMELINE---> | ||
| + | <div style="background: #e58824; padding: 20px; line-height: 0.3em; text-indent: 16px;letter-spacing:0.1em;font-size:26px"><font color=#fbfcfd face="Bebas Neue">PROJECT FUNCTION COMPLETION</font></div> | ||
| + | <div style="margin:0px; padding: 10px; background: #f2f4f4; font-family: Open Sans, Arial, sans-serif; border-radius: 7px; text-align:left"> | ||
| + | {| class="wikitable" style="background-color:#FFFFFF;" width="100%" | ||
| + | |- | ||
| + | | | ||
| + | <b>Function</b> | ||
| + | || | ||
| + | <b>Developer</b> | ||
| + | || | ||
| + | <b>Expected Completion Date</b> | ||
| + | || | ||
| + | <b>Status</b> | ||
| + | |- | ||
| + | | | ||
| + | Required Working Files: Sorting of SHP/KML and CSV files (get required conversion if needed) for application | ||
| + | || | ||
| + | Kaiyang | ||
| + | || | ||
| + | Week 10 | ||
| + | || | ||
| + | Done | ||
| + | |- | ||
| + | | | ||
| + | Issue 1: Conversion of Shape File to Raster Data | ||
| + | || | ||
| + | Kaiyang | ||
| + | || | ||
| + | Week 10 | ||
| + | || | ||
| + | Done (REMOVED) | ||
| + | |- | ||
| + | | | ||
| + | Issue 1: Linking required variables from Server code to UI code | ||
| + | || | ||
| + | Kaiyang | ||
| + | || | ||
| + | Week 11 | ||
| + | || | ||
| + | Done | ||
| + | |- | ||
| + | | | ||
| + | Issue 1: Set up of Raster Data based on Singapore Map | ||
| + | || | ||
| + | Kaiyang | ||
| + | || | ||
| + | Week 11 | ||
| + | || | ||
| + | Done (REMOVED) | ||
| + | |- | ||
| + | | | ||
| + | Issue 1: Mapping Data onto Leaflet | ||
| + | || | ||
| + | Kaiyang | ||
| + | || | ||
| + | Week 11 | ||
| + | || | ||
| + | Done | ||
| + | |- | ||
| + | | | ||
| + | Issue 1: Calculation of Raster Data using Interpolation to show choropleth map on Singapore Map | ||
| + | || | ||
| + | Kaiyang | ||
| + | || | ||
| + | Week 12 | ||
| + | || | ||
| + | Done (REMOVED) | ||
| + | |- | ||
| + | | | ||
| + | Issue 1: Integrating Code with UI | ||
| + | || | ||
| + | Kaiyang | ||
| + | || | ||
| + | Week 12 | ||
| + | || | ||
| + | Done | ||
| + | |- | ||
| + | | | ||
| + | Issue 1: Create buffer for each risk and calculate the risk score for each school | ||
| + | || | ||
| + | Kaiyang | ||
| + | || | ||
| + | Week 13 | ||
| + | || | ||
| + | Done | ||
| + | |- | ||
| + | | | ||
| + | Issue 1: Select the specific of risk within the buffer for each school | ||
| + | || | ||
| + | Kaiyang | ||
| + | || | ||
| + | Week 13 | ||
| + | || | ||
| + | Done | ||
| + | |- | ||
| + | | | ||
| + | Poster | ||
| + | || | ||
| + | Kaiyang | ||
| + | || | ||
| + | Week 13 | ||
| + | || | ||
| + | Done | ||
| + | |- | ||
| + | | | ||
| + | User Guide: PDF User Guide | ||
| + | || | ||
| + | Kaiyang | ||
| + | || | ||
| + | Week 14 | ||
| + | || | ||
| + | Done | ||
| + | |- | ||
| + | | | ||
| + | Issue 2: Testing One Map API to extract location data | ||
| + | || | ||
| + | Mark | ||
| + | || | ||
| + | Week 10 | ||
| + | || | ||
| + | Done | ||
| + | |- | ||
| + | | | ||
| + | Issue 2: Conversion of One Map CSV data to Spatial data for mapping | ||
| + | || | ||
| + | Mark | ||
| + | || | ||
| + | Week 10 | ||
| + | || | ||
| + | Done | ||
| + | |- | ||
| + | | | ||
| + | Issue 2: Calculate route distance and timing of Risk from K Nearest Neighbour of the Response layer using One Map API | ||
| + | || | ||
| + | Mark | ||
| + | || | ||
| + | Week 11 | ||
| + | || | ||
| + | Done | ||
| + | |- | ||
| + | | | ||
| + | Issue 2: One Map API Extraction of Location Data to CSV files | ||
| + | || | ||
| + | Mark | ||
| + | || | ||
| + | Week 11 | ||
| + | || | ||
| + | Done | ||
| + | |- | ||
| + | | | ||
| + | Issue 2: Mapping data onto Leaflet Map | ||
| + | || | ||
| + | Mark | ||
| + | || | ||
| + | Week 11 | ||
| + | || | ||
| + | Done | ||
| + | |- | ||
| + | | | ||
| + | Issue 2: Linking required variables from Server code to UI code | ||
| + | || | ||
| + | Mark | ||
| + | || | ||
| + | Week 12 | ||
| + | || | ||
| + | Done | ||
| + | |- | ||
| + | | | ||
| + | Issue 2: Integrating Code with UI | ||
| + | || | ||
| + | Mark | ||
| + | || | ||
| + | Week 12 | ||
| + | || | ||
| + | Done | ||
| + | |- | ||
| + | | | ||
| + | User Interface: Number Sliders (for buffering / proximity timing), Dropdownlist (for Color, Basemap) | ||
| + | || | ||
| + | Mallika | ||
| + | || | ||
| + | Week 10 | ||
| + | || | ||
| + | Done | ||
| + | |- | ||
| + | | | ||
| + | User Interface: Set up observation on R Server Code | ||
| + | || | ||
| + | Mallika | ||
| + | || | ||
| + | Week 10 | ||
| + | || | ||
| + | Done | ||
| + | |- | ||
| + | | | ||
| + | Backend: Pre-loading of SHP/KML/CSV files to the server | ||
| + | || | ||
| + | Mallika | ||
| + | || | ||
| + | Week 11 | ||
| + | || | ||
| + | Done | ||
| + | |- | ||
| + | | | ||
| + | User Interface: Set up dynamic input/output and link with Map | ||
| + | || | ||
| + | Mallika | ||
| + | || | ||
| + | Week 11 | ||
| + | || | ||
| + | Done | ||
| + | |- | ||
| + | | | ||
| + | User Interface: Home Page to explain the project's goals and descriptions | ||
| + | || | ||
| + | Mallika | ||
| + | || | ||
| + | Week 12 | ||
| + | || | ||
| + | Done | ||
| + | |- | ||
| + | | | ||
| + | Server Development | ||
| + | || | ||
| + | Mallika | ||
| + | || | ||
| + | Week 13 | ||
| + | || | ||
| + | Done | ||
| + | |- | ||
| + | | | ||
| + | Server Debugging | ||
| + | || | ||
| + | Mallika | ||
| + | || | ||
| + | Week 13 | ||
| + | || | ||
| + | Done | ||
| + | |- | ||
| + | |} | ||
| + | </div> | ||
| + | |||
| + | Most functionalities are delayed due to the requirement of completing other module's project work as the deadline is earlier. The team will be dedicating the entire 6th April to 10th April to be working on GeoSpatial Project and only GeoSpatial Project | ||
| + | |||
| + | <!-- END OF FUNCTION COMPLETION ---> | ||
| Line 164: | Line 470: | ||
|- | |- | ||
| | | | ||
| − | <b> | + | <b>Over Function (https://cran.r-project.org/web/packages/sp/vignettes/over.pdf)</b> |
|- | |- | ||
| | | | ||
| − | [[File:IS415-1819-RiskMappers- | + | [[File:IS415-1819-RiskMappers-Reference4.jpg|center|600px]] |
|- | |- | ||
| | | | ||
| − | + | Using this as a reference to calculate the total risk score of each school based on whether their location is within the certain distance buffer of the risk factor<br> | |
| + | Used for: Issue 1: Risk to Students | ||
|- | |- | ||
| | | | ||
| Line 179: | Line 486: | ||
|- | |- | ||
| | | | ||
| − | + | Using this as a reference to create a colored distance buffer for user to know if a location that user chose is beside a risk location.<br> | |
| + | Used for: Issue 2: Reponse Time | ||
|- | |- | ||
| | | | ||
| − | <b> | + | <b>Shiny Example (http://shiny.rstudio.com/gallery/superzip-example.html)</b> |
|- | |- | ||
| | | | ||
| − | [[File:IS415-1819-RiskMappers- | + | [[File:IS415-1819-RiskMappers-Reference5.jpg|center|1000px]] |
|- | |- | ||
| | | | ||
| − | + | Using this as a reference to create R shiny map.<br> | |
| + | Used for: UI | ||
| + | |- | ||
| + | | | ||
| + | <b>Distance Length Mapping (https://rstudio.github.io/leaflet/shiny.html)</b> | ||
| + | |- | ||
| + | | | ||
| + | [[File:IS415-1819-RiskMappers-Reference6.jpg|center|1000px]] | ||
| + | |- | ||
| + | | | ||
| + | Using this as a reference to create setting for response time estimation.<br> | ||
| + | Used for: Issue 1: Risk to Students & UI | ||
|- | |- | ||
|} | |} | ||
| Line 195: | Line 514: | ||
<!-- END OF RELATED WORKS---> | <!-- END OF RELATED WORKS---> | ||
| − | <div style="background: #e58824; padding: 20px; line-height: 0.3em; text-indent: 16px;letter-spacing:0.1em;font-size:26px"><font color=#fbfcfd face="Bebas Neue">PROJECT | + | <div style="background: #e58824; padding: 20px; line-height: 0.3em; text-indent: 16px;letter-spacing:0.1em;font-size:26px"><font color=#fbfcfd face="Bebas Neue">PROJECT STORYBOARD</font></div> |
| + | <div style="margin:0px; padding: 10px; background: #f2f4f4; font-family: Open Sans, Arial, sans-serif; border-radius: 7px; text-align:left"> | ||
| + | {| class="wikitable" style="background-color:#FFFFFF;" width="100%" | ||
| + | |- | ||
| + | | | ||
| + | <div style="text-align:center, text-size: 10px"><b>Issue 1: Risk to Students</b></div> | ||
| + | |- | ||
| + | | | ||
| + | [[File:IS415-1819-RiskMappers-Storyboard-Risk-2.jpg|center|1000px]] | ||
| + | |- | ||
| + | | | ||
| + | Our team plans to create a dashboard for our users to run an analysis on how different risk (Petrol Stations, Tobacco Store, Unhealthy Eateries and Arcades) could affect schools within their vicinity. Risk score will be calculated for each school. Users will be able to look at the highest and lowest risk score schools. Users will also be able to find out specific risk and their location for each school on in a table form. | ||
| + | |- | ||
| + | | | ||
| + | <div style="text-align:center, text-size: 10px"><b>Issue 2: Response Time Analysis</b></div> | ||
| + | |- | ||
| + | | | ||
| + | [[File:IS415-1819-RiskMappers-Storyboard-ResponseTime.jpg|center|1000px]] | ||
| + | |- | ||
| + | | | ||
| + | Our team plans to create a dashboard for our users to run an analysis on different government bodied (Hospital, Police Station, Fire Station, etc) location and their ability to respond to emergency events at certain high risk location. User will be able to select a specific government body, response time and risk location to reach. | ||
| + | |- | ||
| + | |} | ||
| + | </div> | ||
| + | |||
| + | <!-- END OF STORYBOARD---> | ||
| + | |||
| + | <div style="background: #e58824; padding: 20px; line-height: 0.3em; text-indent: 16px;letter-spacing:0.1em;font-size:26px"><font color=#fbfcfd face="Bebas Neue">PROJECT PROTOTYPE</font></div> | ||
<div style="margin:0px; padding: 10px; background: #f2f4f4; font-family: Open Sans, Arial, sans-serif; border-radius: 7px; text-align:left"> | <div style="margin:0px; padding: 10px; background: #f2f4f4; font-family: Open Sans, Arial, sans-serif; border-radius: 7px; text-align:left"> | ||
| − | <b> | + | {| class="wikitable" style="background-color:#FFFFFF;" width="100%" |
| − | + | |- | |
| − | + | | | |
| − | + | <div style="text-align:center, text-size: 10px"><b>Issue 1: Risk to Students (NEW)</b></div> | |
| + | |- | ||
| + | | | ||
| + | [[File:IS415-1819-RiskMappers-Prototype-Risk.jpg|center|1000px]] | ||
| + | |- | ||
| + | | | ||
| + | Our team plans to create a dashboard for our users to run an analysis on how different risk (Petrol Stations, Tobacco Store, Unhealthy Eateries and Arcades) could affect schools within their vicinity. Risk score will be calculated for each school. Users will be able to look at the highest and lowest risk score schools. Users will also be able to find out specific risk and their location for each school on in a table form. | ||
| + | |- | ||
| + | | | ||
| + | <div style="text-align:center, text-size: 10px"><b>Issue 2: Response Time Analysis</b></div> | ||
| + | |- | ||
| + | | | ||
| + | [[File:IS415-1819-RiskMappers-Prototype-ResponseTime.jpg|center|1000px]] | ||
| + | |- | ||
| + | | | ||
| + | Our team plans to create a dashboard for our users to run an analysis on different government bodied (Hospital, Police Station, Fire Station, etc) location and their ability to respond to emergency events at certain high risk location. User will be able to select a specific government body, response time and risk location to reach. | ||
| + | |- | ||
| + | |} | ||
| + | </div> | ||
| − | < | + | <!-- END OF PROTOTYPE---> |
| − | |||
| − | |||
| − | <b>Data | + | <div style="background: #e58824; padding: 20px; line-height: 0.3em; text-indent: 16px;letter-spacing:0.1em;font-size:26px"><font color=#fbfcfd face="Bebas Neue">PROJECT KEY CHALLENGES</font></div> |
| − | + | ||
| − | + | <div style="margin:0px; padding: 10px; background: #f2f4f4; font-family: Open Sans, Arial, sans-serif; border-radius: 7px; text-align:left"> | |
| + | {| class="wikitable" style="background-color:#FFFFFF;" width="100%" | ||
| + | |- | ||
| + | | | ||
| + | <b>No.</b> | ||
| + | || | ||
| + | <b>Key Technical Challenges</b> | ||
| + | || | ||
| + | <b>Description</b> | ||
| + | || | ||
| + | <b>Proposed Solution</b> | ||
| + | || | ||
| + | <b>Outcome</b> | ||
| + | |- | ||
| + | | | ||
| + | 1. | ||
| + | || | ||
| + | Unfamiliarity with R | ||
| + | || | ||
| + | The team plans on using R and creating an R dashboard for the project. | ||
| + | || | ||
| + | - Initial hands-on experience during class<br> | ||
| + | - DataCamp course on R shiny and geospatial analysis<br> | ||
| + | - Independent learning on R<br> | ||
| + | - Independent learning on R<br> | ||
| + | - Peer learning and sharing | ||
| + | || | ||
| + | We managed to solve our technical challenge with the following:<br> | ||
| + | - Found examples online<br> | ||
| + | - Asked Professor Kam for help | ||
| + | |- | ||
| + | | | ||
| + | 2. | ||
| + | || | ||
| + | Data Cleaning and Transformation | ||
| + | || | ||
| + | The data collected is generally in different formats. The scales of the data, the coordinate reference system etc. may all be different. | ||
| + | || | ||
| + | Having a systematic process while working together in order to maximise efficiency e.g. taking turns to clean, transform and perform checks on the data to ensure accuracy. | ||
| + | || | ||
| + | We managed to solve our technical challenge with the following:<br> | ||
| + | - Found examples of geocoding and csv conversion online<br> | ||
| + | - Used Excel to do basic data transformation<br> | ||
| + | - Used QGIS to convert csv to SHP file | ||
| + | |- | ||
| + | | | ||
| + | 3. | ||
| + | || | ||
| + | Integrating Relevant Data from Multiple Sources | ||
| + | || | ||
| + | Narrowing down data collected to what is relevant to our project is imperative before we can begin its analysis. | ||
| + | || | ||
| + | Working together and meeting up to understand and decide on what data to extract, to analyse or to reject. | ||
| + | || | ||
| + | We managed to solve our technical challenge with the following:<br> | ||
| + | - Meeting up and integrate together<br> | ||
| + | - Search for debugging solutions online | ||
| + | |- | ||
| + | | | ||
| + | 4. | ||
| + | || | ||
| + | Information Presentation | ||
| + | || | ||
| + | Determining the most effective way to visualise and display the data in an interactive format is of essence. It is necessary that the most important information is easily discernible from the map. | ||
| + | || | ||
| + | Gain exposure to different mapping techniques.<br> | ||
| + | Follow and revisit techniqes explored in class<br> | ||
| + | Also look at datacamp courses. | ||
| + | || | ||
| + | We managed to solve our technical challenge with the following:<br> | ||
| + | - Found examples online<br> | ||
| + | - Asked Professor Kam for help | ||
| + | |- | ||
| + | |} | ||
| − | |||
| − | |||
| − | |||
</div> | </div> | ||
| Line 219: | Line 651: | ||
<div style="background: #e58824; padding: 20px; line-height: 0.3em; text-indent: 16px;letter-spacing:0.1em;font-size:26px"><font color=#fbfcfd face="Bebas Neue">PROJECT TOOLS AND TECHNOLOGIES</font></div> | <div style="background: #e58824; padding: 20px; line-height: 0.3em; text-indent: 16px;letter-spacing:0.1em;font-size:26px"><font color=#fbfcfd face="Bebas Neue">PROJECT TOOLS AND TECHNOLOGIES</font></div> | ||
<div style="margin:0px; padding: 10px; background: #f2f4f4; font-family: Open Sans, Arial, sans-serif; border-radius: 7px; text-align:left"> | <div style="margin:0px; padding: 10px; background: #f2f4f4; font-family: Open Sans, Arial, sans-serif; border-radius: 7px; text-align:left"> | ||
| − | <b>The following are tools and technologies that our team currently | + | <b>The following are the tools and technologies that our team currently aims on using (to be updated)</b><br> |
[[File:IS415-1819-RiskMappers-Technology.jpg |1000px|center]] | [[File:IS415-1819-RiskMappers-Technology.jpg |1000px|center]] | ||
| − | |||
</div> | </div> | ||
| Line 243: | Line 674: | ||
<div style="background: #e58824; padding: 20px; line-height: 0.3em; text-indent: 16px;letter-spacing:0.1em;font-size:26px"><font color=#fbfcfd face="Bebas Neue">REFERENCES</font></div> | <div style="background: #e58824; padding: 20px; line-height: 0.3em; text-indent: 16px;letter-spacing:0.1em;font-size:26px"><font color=#fbfcfd face="Bebas Neue">REFERENCES</font></div> | ||
<div style="margin:0px; padding: 10px; background: #f2f4f4; font-family: Open Sans, Arial, sans-serif; border-radius: 7px; text-align:left"> | <div style="margin:0px; padding: 10px; background: #f2f4f4; font-family: Open Sans, Arial, sans-serif; border-radius: 7px; text-align:left"> | ||
| − | <b> | + | {| class="wikitable" style="background-color:#FFFFFF;" width="100%" |
| + | |- | ||
| + | | | ||
| + | <b>No.</b> | ||
| + | || | ||
| + | <b>Website Name</b> | ||
| + | || | ||
| + | <b>URL</b> | ||
| + | |- | ||
| + | | | ||
| + | 1. | ||
| + | || | ||
| + | Innovative Solutions for a Smart City | ||
| + | || | ||
| + | https://www.smartnation.sg/resources/innovative-solutions-for-a-smart-city | ||
| + | |- | ||
| + | | | ||
| + | 2. | ||
| + | || | ||
| + | Smart Nation Leveraging on Technology to Improve our Urban Environment | ||
| + | || | ||
| + | https://www.smartnation.sg/initiatives/Living/leveraging-technology-to-improve-our-urban-environment | ||
| + | |- | ||
| + | | | ||
| + | 3. | ||
| + | || | ||
| + | Topographic Map | ||
| + | || | ||
| + | http://en-sg.topographic-map.com/places/Singapore-1331643/ | ||
| + | |- | ||
| + | | | ||
| + | 4. | ||
| + | || | ||
| + | Shiny Widget | ||
| + | || | ||
| + | https://shiny.rstudio.com/gallery/widget-gallery.html | ||
| + | https://rstudio.github.io/leaflet/shiny.html | ||
| + | |- | ||
| + | | | ||
| + | 5. | ||
| + | || | ||
| + | Shiny Dashboard | ||
| + | || | ||
| + | https://rstudio.github.io/shinydashboard/ | ||
| + | https://www.rstudio.com/resources/webinars/dynamic-dashboards-with-shiny/ | ||
| + | http://shiny.rstudio.com/gallery/superzip-example.html | ||
| + | |- | ||
| + | | | ||
| + | 6. | ||
| + | || | ||
| + | Leaflet Notes | ||
| + | || | ||
| + | https://www.youtube.com/channel/UCVvv6HyBo9pg5-URPeJPQEw | ||
| + | |- | ||
| + | | | ||
| + | 7. | ||
| + | || | ||
| + | Isochrones Example | ||
| + | || | ||
| + | https://www.hydrol-earth-syst-sci.net/2/265/1998/hess-2-265-1998.pdf | ||
| + | |- | ||
| + | | | ||
| + | 8. | ||
| + | || | ||
| + | Isochrones Example | ||
| + | || | ||
| + | https://www.atlasobscura.com/articles/isochrone-maps-commutes-travel-times | ||
| + | |- | ||
| + | | | ||
| + | 9. | ||
| + | || | ||
| + | Over Function Example | ||
| + | || | ||
| + | https://cran.r-project.org/web/packages/sp/vignettes/over.pdf | ||
| + | |- | ||
| + | | | ||
| + | 10. | ||
| + | || | ||
| + | Sapply Function Example | ||
| + | || | ||
| + | https://cengel.github.io/rspatial/3_spDataOps.nb.html | ||
| + | |- | ||
| + | | | ||
| + | 11. | ||
| + | || | ||
| + | Batch Geocoding | ||
| + | || | ||
| + | https://www.doogal.co.uk/BatchGeocoding.php | ||
| + | |- | ||
| + | | | ||
| + | 12. | ||
| + | || | ||
| + | JSON to CSV | ||
| + | || | ||
| + | https://json-csv.com/ | ||
| + | |- | ||
| + | | | ||
| + | 13. | ||
| + | || | ||
| + | CSV to SHP | ||
| + | || | ||
| + | https://mygeodata.cloud/converter/csv-to-shp | ||
| + | |- | ||
| + | |} | ||
</div> | </div> | ||
Latest revision as of 17:18, 15 April 2018
|
Risk in Singapore Risk and hazard are terms commonly used to describe aspects of the potential for harm caused by environmental factors and other agents. In Singapore’s endeavour to be a healthy, safe and prepared smart nation, the most important age group of the population is of children - the future generations of our country. Children and teenagers aged 6 thru 16 are in the most susceptible and impressionable years of their life and therefore, it is important for us to better understand the vicinity of institutions that younger generations attend, the key ones being primary and secondary schools. This analysis will also help parents in choosing schools while being aware of the potential risks and vulnerabilities their children might be exposed to. For the sake of scope, we have restricted ourselves to three types of risks - health (tobacco and unhealthy eateries), entertainment (arcades) and terrorist (petrol stations, as a representative of the same). We then analyse the total number of risk factors to assign a risk score to each school that is later mapped out. With the launch of SGSecure in 2016, it is evident that Singapore’s government has been taking emergency preparedness seriously. Therefore, the second part of our analysis, the response analysis is with regards to the key public service institutions that are expected to operate 24/7 and include emergency rooms in hospitals, fire stations and police stations. |
|
Geographical Risk Analysis |
Each layer represents a specific area of risk which certain institutions pose to a student. By including each layer it allows users to visualize possible risks in each locale.
|
|
Functionality |
1. Visual Risk Analysis |
|
Usage |
Our visualization allows users to comprehend how much potential risk each area is exposed to. From this information, we hope to aid in Singapore's goals of Smart City planning to take into consideration not only ease of access to the population but also the risk different institutions pose to inhabitants. |
|
Issue 1 | |
|
Issue 2 |
Our team's datasets are retrieved from https://data.gov.sg
|
Title |
Format |
Used for Issue 1 or 2 |
Website Link |
|
Primary/Secondary School |
CSV |
Both Issue |
|
|
Petrol Station |
Unformatted (format to csv) |
Issue 1: Risk to Students |
https://www.caltex.com/sg/find-a-caltex-station.html |
|
Unhealthy Eateries |
KML |
Issue 1: Risk to Students |
|
|
Tobacco License |
CSV |
Issue 1: Risk to Students |
https://data.gov.sg/dataset/listing-of-licensed-tobacco-retailers |
|
Acrades |
Unformatted (format to csv) |
Issue 1: Risk to Students |
http://www.streetdirectory.com/businessfinder/company_branch/157187/127270/ |
|
Hospital |
CSV |
Issue 2: Response Time |
|
|
Police Station |
CSV |
Issue 2: Response Time |
|
|
Fire Station |
CSV |
Issue 2: Response Time |
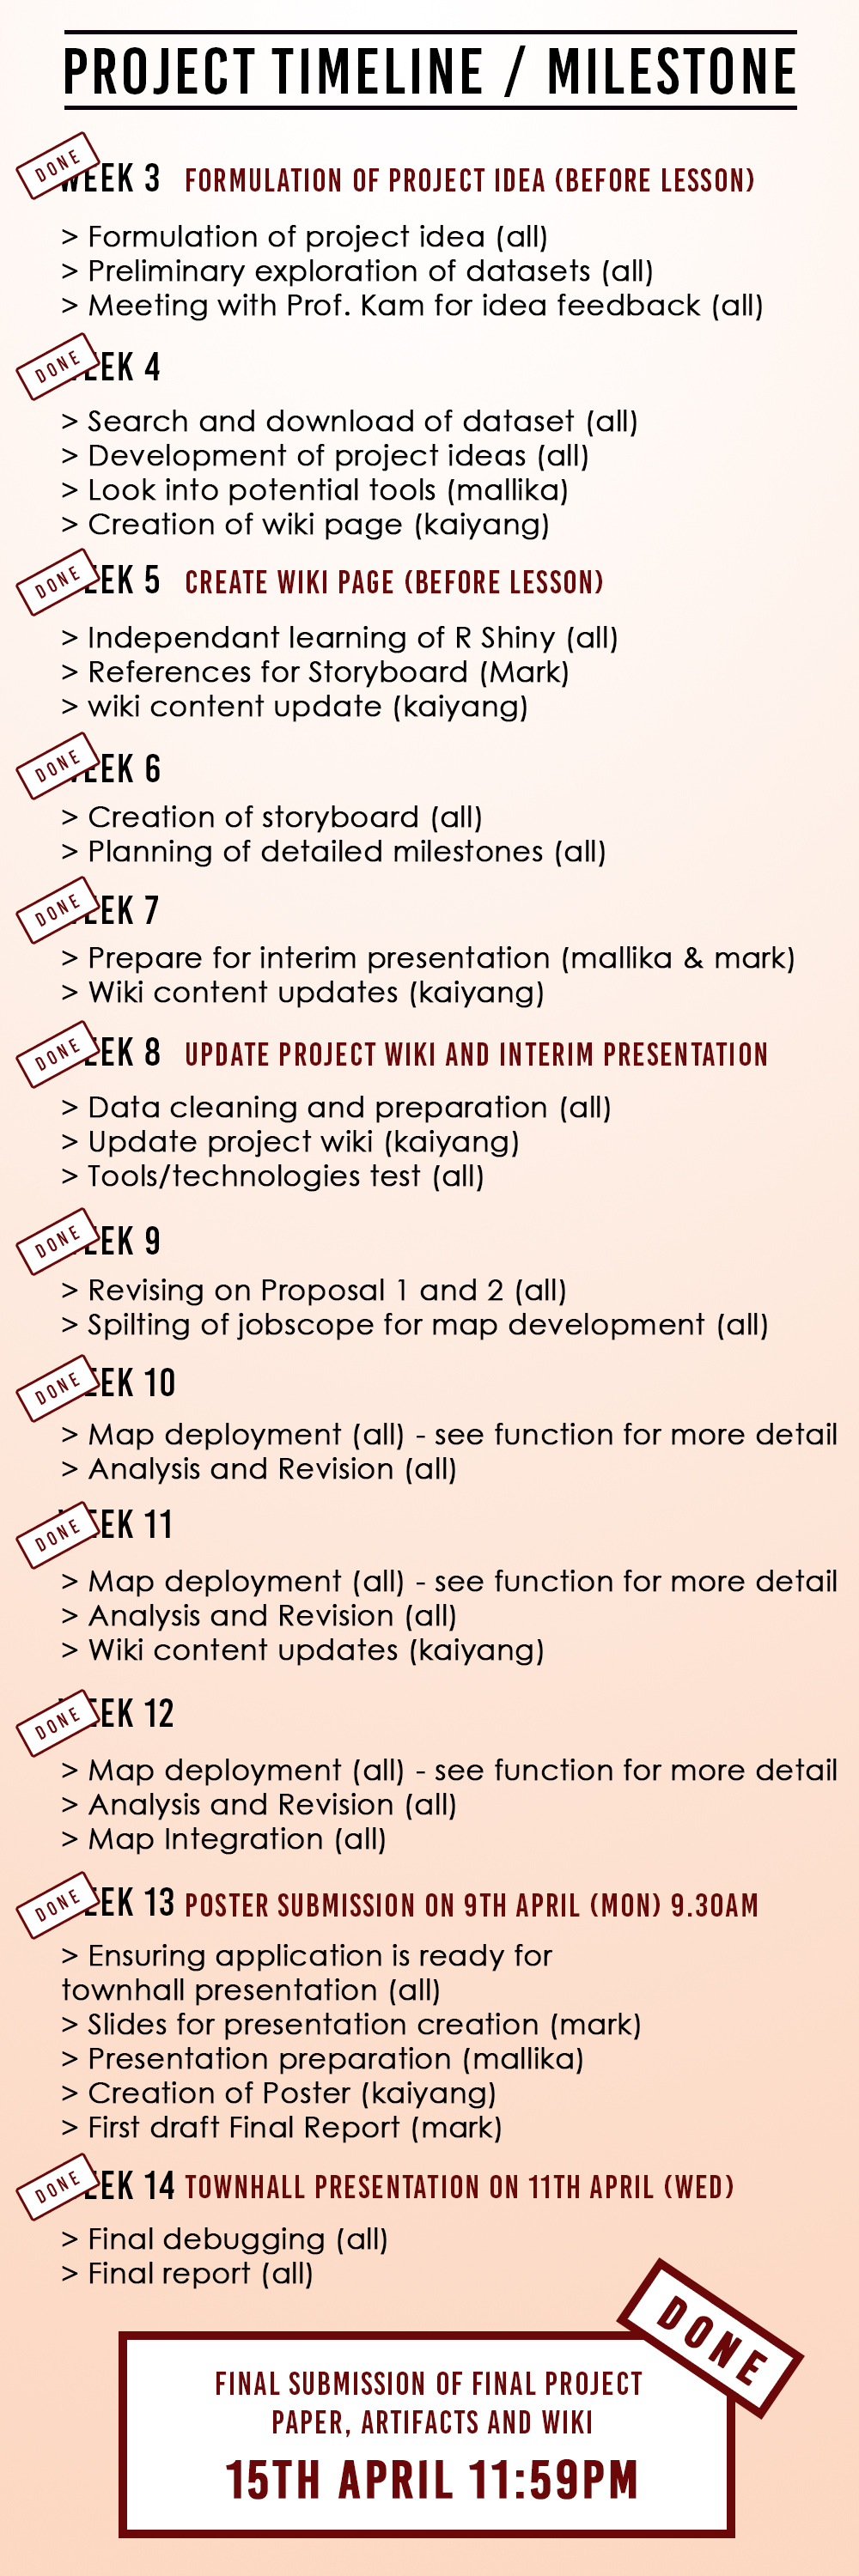
This a ROUGH timeline of our entire project. Milestones indicated are according to IS415 AY1718 Project Wiki Page (Detailed timeline will be updated)
|
Function |
Developer |
Expected Completion Date |
Status |
|
Required Working Files: Sorting of SHP/KML and CSV files (get required conversion if needed) for application |
Kaiyang |
Week 10 |
Done |
|
Issue 1: Conversion of Shape File to Raster Data |
Kaiyang |
Week 10 |
Done (REMOVED) |
|
Issue 1: Linking required variables from Server code to UI code |
Kaiyang |
Week 11 |
Done |
|
Issue 1: Set up of Raster Data based on Singapore Map |
Kaiyang |
Week 11 |
Done (REMOVED) |
|
Issue 1: Mapping Data onto Leaflet |
Kaiyang |
Week 11 |
Done |
|
Issue 1: Calculation of Raster Data using Interpolation to show choropleth map on Singapore Map |
Kaiyang |
Week 12 |
Done (REMOVED) |
|
Issue 1: Integrating Code with UI |
Kaiyang |
Week 12 |
Done |
|
Issue 1: Create buffer for each risk and calculate the risk score for each school |
Kaiyang |
Week 13 |
Done |
|
Issue 1: Select the specific of risk within the buffer for each school |
Kaiyang |
Week 13 |
Done |
|
Poster |
Kaiyang |
Week 13 |
Done |
|
User Guide: PDF User Guide |
Kaiyang |
Week 14 |
Done |
|
Issue 2: Testing One Map API to extract location data |
Mark |
Week 10 |
Done |
|
Issue 2: Conversion of One Map CSV data to Spatial data for mapping |
Mark |
Week 10 |
Done |
|
Issue 2: Calculate route distance and timing of Risk from K Nearest Neighbour of the Response layer using One Map API |
Mark |
Week 11 |
Done |
|
Issue 2: One Map API Extraction of Location Data to CSV files |
Mark |
Week 11 |
Done |
|
Issue 2: Mapping data onto Leaflet Map |
Mark |
Week 11 |
Done |
|
Issue 2: Linking required variables from Server code to UI code |
Mark |
Week 12 |
Done |
|
Issue 2: Integrating Code with UI |
Mark |
Week 12 |
Done |
|
User Interface: Number Sliders (for buffering / proximity timing), Dropdownlist (for Color, Basemap) |
Mallika |
Week 10 |
Done |
|
User Interface: Set up observation on R Server Code |
Mallika |
Week 10 |
Done |
|
Backend: Pre-loading of SHP/KML/CSV files to the server |
Mallika |
Week 11 |
Done |
|
User Interface: Set up dynamic input/output and link with Map |
Mallika |
Week 11 |
Done |
|
User Interface: Home Page to explain the project's goals and descriptions |
Mallika |
Week 12 |
Done |
|
Server Development |
Mallika |
Week 13 |
Done |
|
Server Debugging |
Mallika |
Week 13 |
Done |
Most functionalities are delayed due to the requirement of completing other module's project work as the deadline is earlier. The team will be dedicating the entire 6th April to 10th April to be working on GeoSpatial Project and only GeoSpatial Project
|
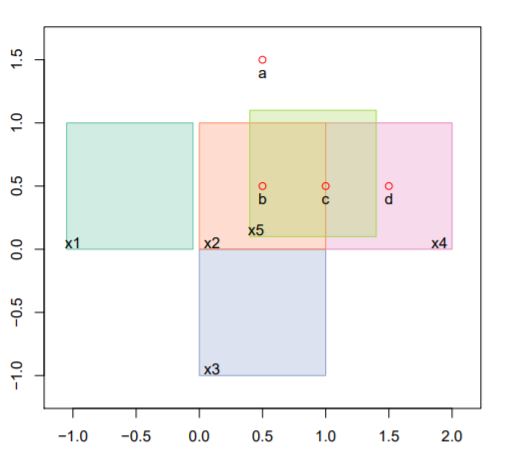
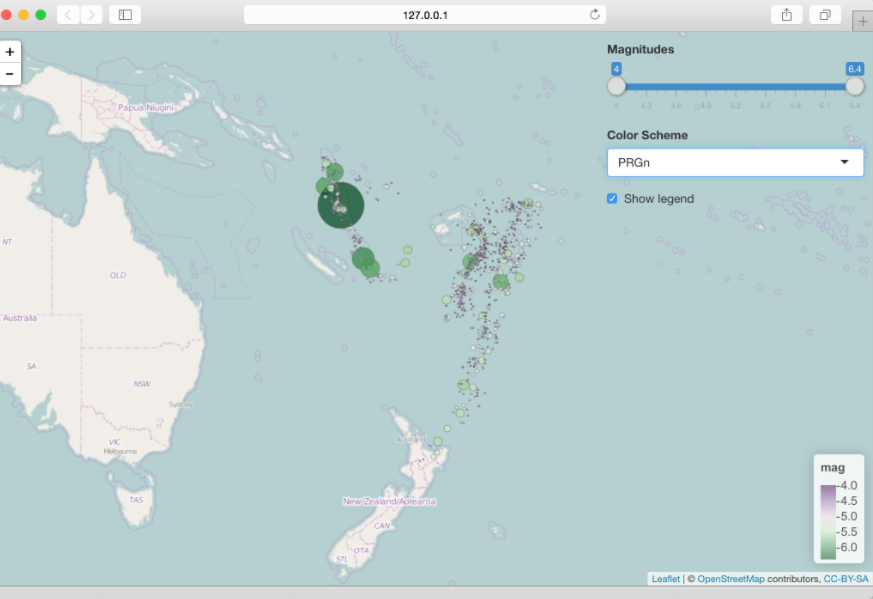
Over Function (https://cran.r-project.org/web/packages/sp/vignettes/over.pdf) |
|
Using this as a reference to calculate the total risk score of each school based on whether their location is within the certain distance buffer of the risk factor |
|
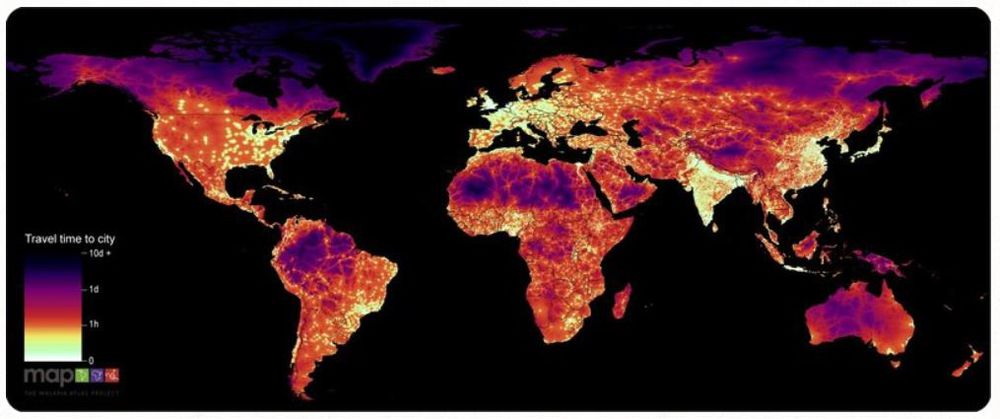
Dengue Outbreak Mapping (http://outbreak.sgcharts.com) |
|
Using this as a reference to create a colored distance buffer for user to know if a location that user chose is beside a risk location. |
|
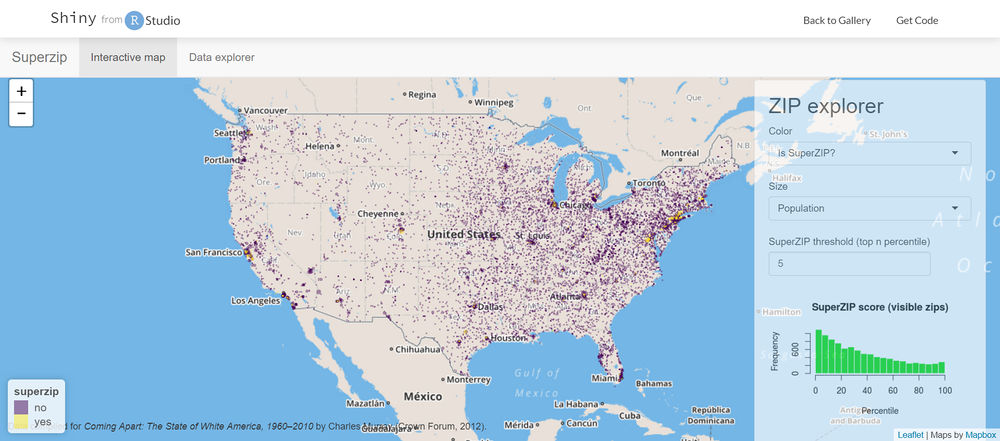
Shiny Example (http://shiny.rstudio.com/gallery/superzip-example.html) |
|
Using this as a reference to create R shiny map. |
|
Distance Length Mapping (https://rstudio.github.io/leaflet/shiny.html) |
|
Using this as a reference to create setting for response time estimation. |
|
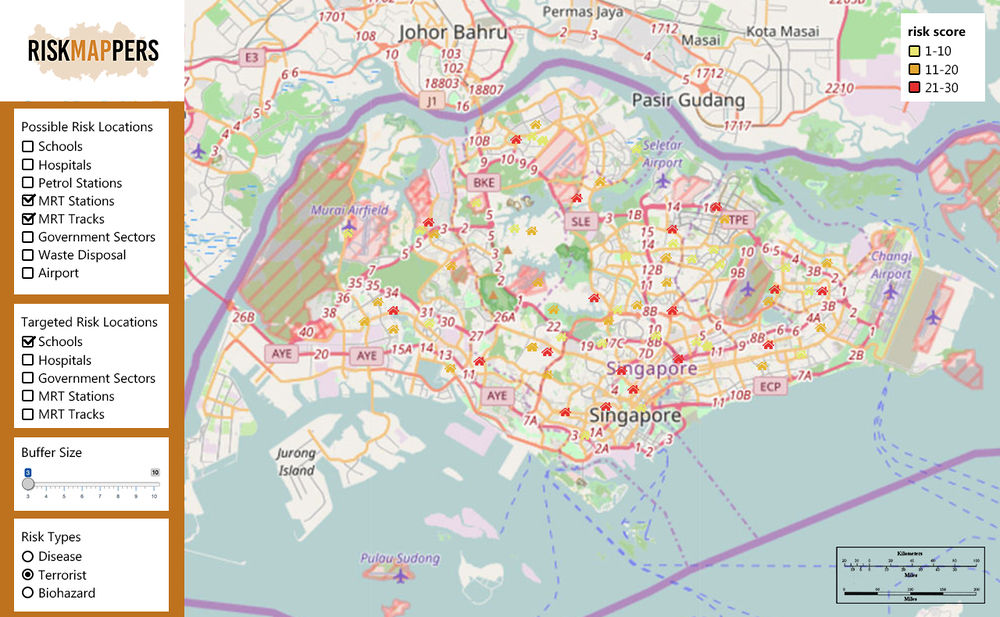
Issue 1: Risk to Students
|
|
Our team plans to create a dashboard for our users to run an analysis on how different risk (Petrol Stations, Tobacco Store, Unhealthy Eateries and Arcades) could affect schools within their vicinity. Risk score will be calculated for each school. Users will be able to look at the highest and lowest risk score schools. Users will also be able to find out specific risk and their location for each school on in a table form. |
|
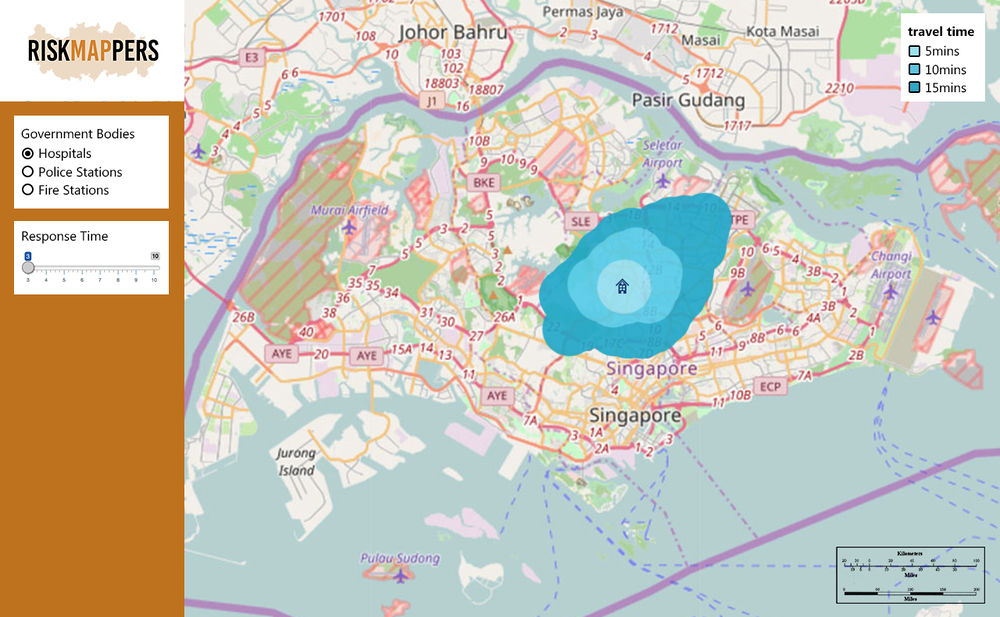
Issue 2: Response Time Analysis
|
|
Our team plans to create a dashboard for our users to run an analysis on different government bodied (Hospital, Police Station, Fire Station, etc) location and their ability to respond to emergency events at certain high risk location. User will be able to select a specific government body, response time and risk location to reach. |
|
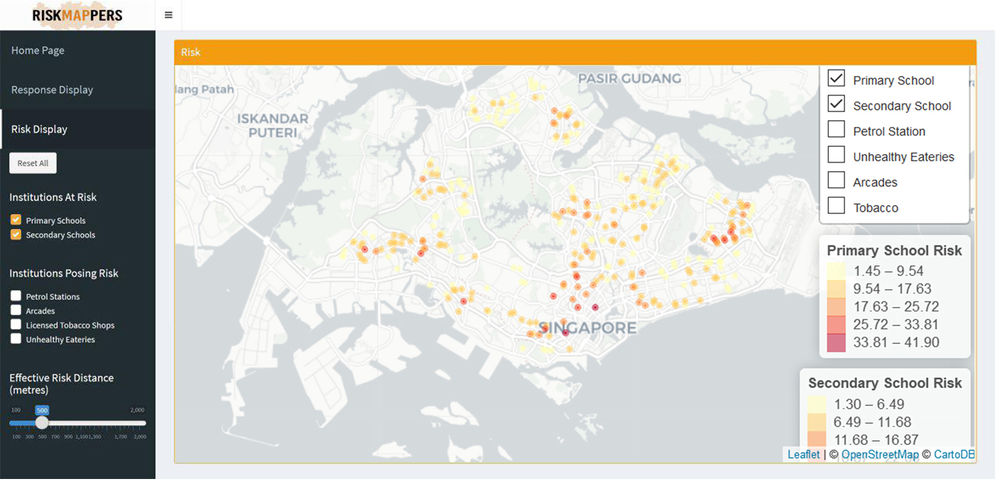
Issue 1: Risk to Students (NEW)
|
|
Our team plans to create a dashboard for our users to run an analysis on how different risk (Petrol Stations, Tobacco Store, Unhealthy Eateries and Arcades) could affect schools within their vicinity. Risk score will be calculated for each school. Users will be able to look at the highest and lowest risk score schools. Users will also be able to find out specific risk and their location for each school on in a table form. |
|
Issue 2: Response Time Analysis
|
|
Our team plans to create a dashboard for our users to run an analysis on different government bodied (Hospital, Police Station, Fire Station, etc) location and their ability to respond to emergency events at certain high risk location. User will be able to select a specific government body, response time and risk location to reach. |
|
No. |
Key Technical Challenges |
Description |
Proposed Solution |
Outcome |
|
1. |
Unfamiliarity with R |
The team plans on using R and creating an R dashboard for the project. |
- Initial hands-on experience during class |
We managed to solve our technical challenge with the following: |
|
2. |
Data Cleaning and Transformation |
The data collected is generally in different formats. The scales of the data, the coordinate reference system etc. may all be different. |
Having a systematic process while working together in order to maximise efficiency e.g. taking turns to clean, transform and perform checks on the data to ensure accuracy. |
We managed to solve our technical challenge with the following: |
|
3. |
Integrating Relevant Data from Multiple Sources |
Narrowing down data collected to what is relevant to our project is imperative before we can begin its analysis. |
Working together and meeting up to understand and decide on what data to extract, to analyse or to reject. |
We managed to solve our technical challenge with the following: |
|
4. |
Information Presentation |
Determining the most effective way to visualise and display the data in an interactive format is of essence. It is necessary that the most important information is easily discernible from the map. |
Gain exposure to different mapping techniques. |
We managed to solve our technical challenge with the following: |
We appreciate and cherish all comments. If you have any suggestion on how to improve our project. Please help us by keying in your name and comment. Don't worry, we want to know your name so that we can thank you and ask for more details. And we don't bite. (:
|
No. |
Name |
Date |
Comments |
|
1. |
Insert your Name here |
Insert Date here |
Insert Comment here |
|
2. |
Insert your Name here |
Insert Date here |
Insert Comment here |
|
3. |
Insert your Name here |
Insert Date here |
Insert Comment here |
