ISSS608 2017-18 T1 Group5 Report
| PROPOSAL | REPORT | POSTER | APPLICATION| |
Contents
1. Introduction
1.1 Background
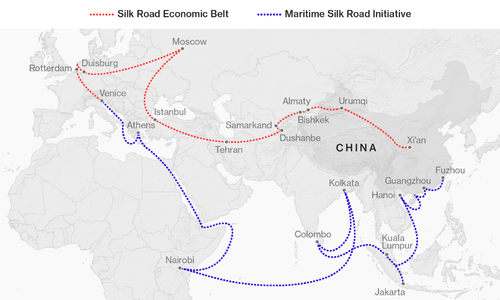
The Silk Road Economic Belt and the 21st-century Maritime Silk Road, better known as the One Belt and One Road Initiative (OBOR), The Belt and Road (B&R) is a development strategy proposed by China's paramount leader Xi Jinping in 2013 that focuses on connectivity and cooperation between Eurasian countries, primarily the People's Republic of China (PRC). The initiative underlines China's push to take a role in global affairs with a China-centered trading network. The routes cover more than 60 countries in 6 regions. The B&R countries accounting for around 31% of global GDP and more than 34% of the world's merchandise trade.
While the infrastructural development B&R initiative largely focused on rail and maritime links in the first two years, aviation is gradually entering the picture. Constructed 15 new airports and expanded 28 existing ones. Chinese airlines witnessed a robust revenue passenger kilometre growth of 70% with the B&R countries from 2013 to 2015.
Aviation Expansion Accelerated in 2017. 95 new air routes are opened between China and other B&R countries. The support of the Chinese government has helped boost the number of passengers flying between China and B&R countries and regions, which has soared, rising 18.5 percent year-on-year to 8.58 million during first four months of 2017.
1.2 Challenges
• Data quality, quantity, and availability
The main challenge of doing analysis on the development of aviation industry in B&R was lack of data. The historical flight information is not open to public, and the present flight information was not well structured. The data set available was usually crawled by individuals and is of very poor quality.
• Not enough statistics available to the public
There are a lot of news about how the expansion of aviation industry helped in the development of B&R initiative. However, there is no consolidated statistic available that provide numerical evidence to quantify the contribution and development of aviation industry.
• No intuitive overview of aviation expansion
Only very few analyses were done focusing on the role of aviation industry in B&R. Those analysis were all report based. There is no interactive dashboard designed for users to study the performance of aviation industry between China and other B&R countries.
1.3 Motivation
Speaking of Belt and Road, people always put their focus on railway and maritime transportation. However, aviation is making depth and extend contributions to the B&R Initiative by the expansion of air routes and the development of air transport. China’s air transportation, aviation infrastructure and aircraft manufacturing are expected to achieve unprecedented demand growth and the industry’s internationalization is expected to accelerate.
Hence, in this project, we would like to focus on the aviation industry of china and other B&R countries to investigate how aviation industry has been expanded to support the vast transport demand between china and other B&R countries.
1.4 Objectives
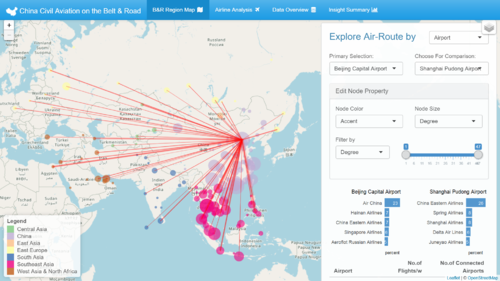
The main purpose of this project is to investigate the flight network between China and the “Belt and Road” countries to explore the economic connectivity and development potential. A visual exploration tool will be implemented using R shiny which can be used to easily explore and understand the flight network. The designed dashboard should follow the criteria listed below:
• Show the flight network connectivity between China and the B&R countries
• Show the performance of different regions, countries, airports and airline companies
• Web-based visualization tool using R shiny for interactive exploration
2.Methodology
2.1 Design Framework
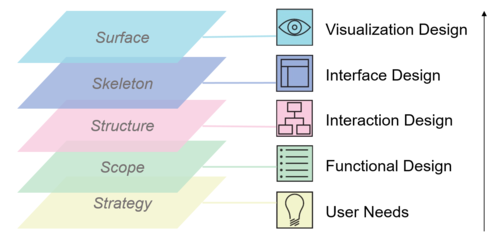
The design flow of our dashboard follows the process below, which is a widely adopted framework of user experience design. There are 5 layers from strategy to final visualization executed from bottom to top. 
• Strategy Layer
Identify user needs is the first step to start dashboard design. The major pain point we are solving is to allow users exploring the flight network between China and the B&R countries using visualization tool and aggregated data.
• Scope Layer
In terms of functionality design, the major features of this dashboard are for users to view geographical air transportation network, investigate connectivity of different nodes and study airline company performance.
• Structure Layer
As for interaction design, we have different elements used for different interactive features. An interactive data table is implemented to allow simple searching in dataset used. Sliders will be used for users to filter based on continuous variables like degree, centrality. We will be using treemap and select input box for filtering based on categorical variables like name, IATA, country. By using popup box, users can view information/label dynamically. Foldable panels can be used when space is limited.
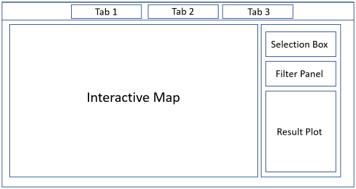
• Skeleton Layer: the interface design is sketched using wireframes as below:
• Surface Layer: lastly, we add in of visualization elements to help making this dashboard more intuitive and pleasing to the eye.
In short, our dashboard design will take into considerations of aesthetic, intuitive, interactive, Informative elements for better user experience.
2.2 Data Description
To support our design framework, we use data from various sources. As Chinese flight data are not public, the flight data used in this project is crawled from VariFlight using Python and other supporting data are collected from Flightradar24, Thematic Mapping and the official website of Civil Aviation Administration of China (CAAC). VariFight and Flightradar24 are both the Chinese Internet service providers on aviation data and real-time flight status. Thematic Mapping is a provider of web mapping and geographic information.
The following figure shows part of the raw data crawled.
After cleaning, data used in this project mainly include the following four parts:
-> Air-routes from China to B&R countries in 2013 & 2017
• Origin

• Destination

• Airline Company

• Departure and Arrival Time

• Flight Number
-> Airport Information
• IATA Code

• ICAO Code

• Airport Name

• Geographical Information: Airport Latitude, Longitude, Altitude, Subordinate Province and City
-> Airline Companies Information
• Airline Name

• Country

• IATA Code

• Country
-> Boundary Information of countries all over the world
• World Border Dataset in shapefile format
