ISSS608 2017-18 T1 Group6 Report
From Visual Analytics and Applications
Jump to navigation
Jump to search
 Group 6 - How is Beijing Air Quality?
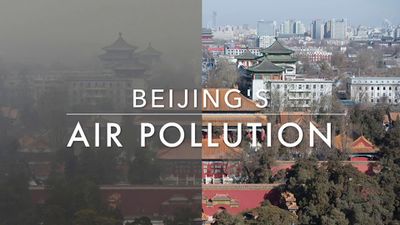
MOTIVATION
REVIEW AND CRITIQUE OF PRIOR WORK
DATA PREPARATION
1.Dataset Introduction
2.Data Pre-processing
Design Framework
1.Interface
1.1 Page 1:
1.2 Page 2:
1.3 Page 3:
1.4 Page 4:
2.Analytical Visualizations
2.1 Line Chart:
2.2 Bar Chart:
2.3 Spider Chart:
2.4 Raster Map:
2.5 Geofacet Line Graphs:
DISCUSSION
FUTURE SCOPE
INSTALLATION GUIDE
USER GUIDE
REFERENCES