ISSS608 2017-18 T1 Assign RYAN CHIA
Contents
Overview
Smartpolis is a major metropolitan area with a population of approximately two million residents. During the last few days, health professionals at local hospitals have noticed a dramatic increase in reported illnesses. Observed symptoms are largely flulike and include fever, chills,sweats, aches and pains, fatigue, coughing, breathing difficulty, nausea and vomiting, diarrhea, and enlarged lymph nodes. More recently, there have been several deaths believed to be associated with the current outbreak. City officials fear a possible epidemic and are mobilizing emergency management resources to mitigate the impact. You have been charged with providing an assessment of the situation.
Hypothesis
The tremendous spike in the number of people reporting ill noticed between 18 May to 20 May was a result of 2 independent mishaps that happened on the 17 May.
The first epidemic was caused by an Industrial Property Explosion that occurred in the region of Smogtown. The residue from the particles released into the air by the explosion, is believed to be blown from the west to the Downtown and Uptown districts, and beyond, during the night, causing many to wake up the following day with respiratory disorder symptoms.
The second epidemic is believed to be derived from a water transmitted catalyst resultant from a Cargo Spill caused by an accident along bridge 610 just off the Downtown district. The catalyst is believed to have been pushed downstream into the river flowing pass the Westside and Plainville districts respectively. This phenomenon resulted to occupants along the aisle of the river developing symptoms of digestive disorder symptoms likely cause by interaction with the water supply.
Both illnesses are believed to not be transmittable between humans and there is insufficient data to observe the time to recovery for the affected people. However, containment is required for the second epidemic but not the first since the number of people detected with respiratory disorder symptoms showed decline on the second day of the epidemic while the number of people detected with digestive disorder symptoms increased, signalling a potential prolonged problem.
Epidemic Detection
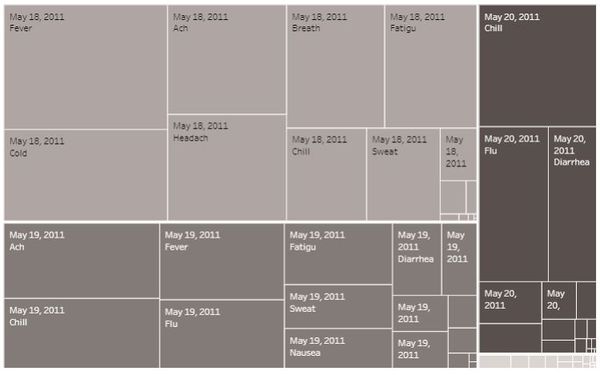
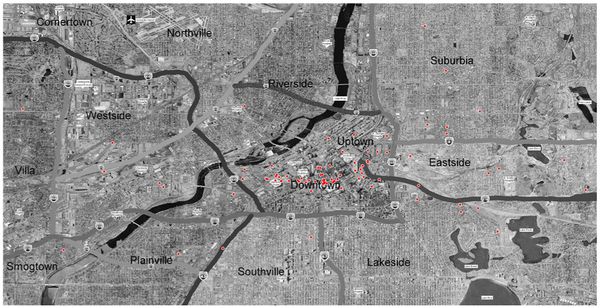
At a glance, an epidemic could be easily detected through a tremendous spike in the number of reported cases detected between 17 May and 18 May as shown in the image below.
As symptoms like Flu, Fever, Chill, Cold are the human body's typical response to the intrusion of a foreign agent, they only form the indicators that a person has fallen ill. As such, by nature of them being the natural response of the human body, they had to be discounted from the data when trying to determine the source of the epidemic. Consequentially, the following could be unique symptoms could be observed on 18 May, namely:
- Breathing Issues
- Fatigue
- Sweat
This formed the first basis of the hypothesis that an event must have happened to caused the epidemic and that it must have been transmitted airborne since the first reported cases of the epidemic showed signs of Respiratory Disorder Symptoms like Shortness of Breath and Fatigue.
Interestingly enough, a separate set of symptoms were observed on 19 and 20 May. While the number of people depicting Respiratory symptoms saw a fall, the number of people show casing Digestive Disorder Symptoms along the river leading towards Smogtown rose dramatically. While initial suspicions of these phenomenon was initially thought to be related to the same event that caused the Respiratory Disorder Symptoms, further investigation seem to indicate a different source to the issue.
Respiratory Disorder Epidemic
Illness Discovery & Detection
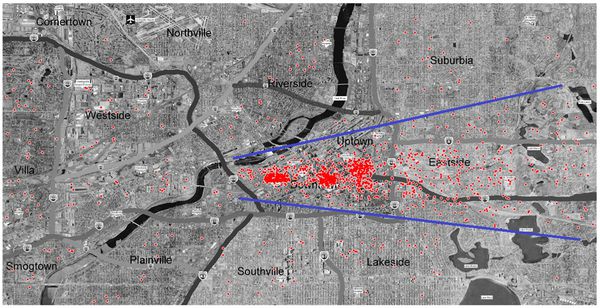
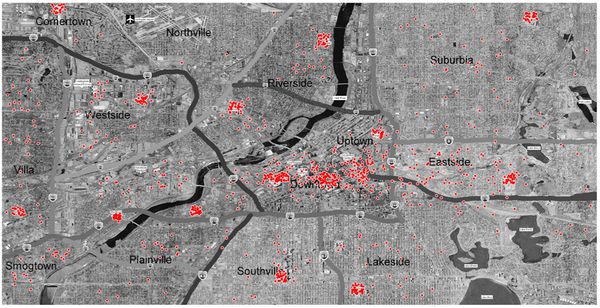
The above image depicts the spike of number of detected illnesses through communication channels between 17 May and 18 May. While we cannot be sure who the ill party in the conversation is, the assumption in place is that wherever either party may be, they are in relatively close proximity by nature of their friendship. Bearing that assumption in mind, we may observe a pattern in the data of people identified to be with illness. The image below highlights this pattern more clearly.
Spread Theory & Validation Criteria
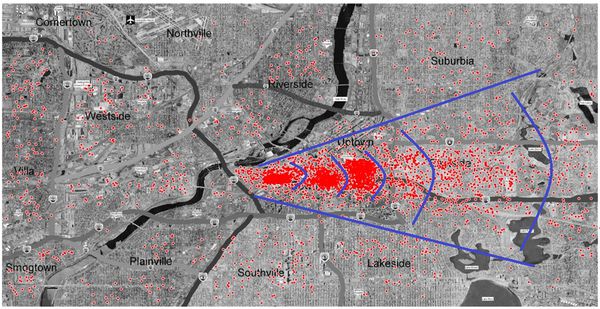
At a glance, we could almost see the layering of infected people as illness spreads from the origin. The concentration of the number of detected illness cases ranging from the Downtown district to the Eastside district is reminiscent of an object travelling in a direct and losing momentum as it progress. This brought about the theory that the illness could be an airborne disease by studying the pattern of spread. In order for this theory to hold, the following 3 events must be true:
- People contracting the illness must show symptoms of Airborne illnesses
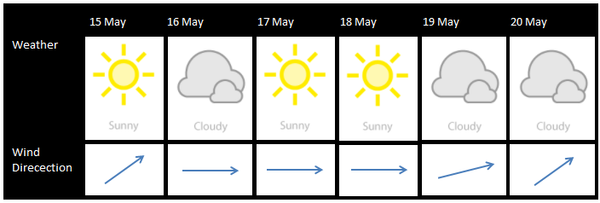
- Weather and Wind direction must be and blow in accordance to the climate necessary for East-bound movement of illness catalyst
- There had to be highly probable source propagating the illness west of the infected zone.
Symptoms of Airborne Illness
According to Healthline.com symptoms of an Airborne illness are as follows:
- inflammation of your nose, throat, sinuses, or lungs
- coughing
- sneezing
- congestion
- runny nose
- sore throat
- swollen glands
- headache
- body aches
- loss of appetite
- fever
- fatigue
Based on the symptoms detected from the data, we observed a jump in 6 of the 12 symptoms to look out for. This reflects a high probability that the illness catalyst may have been transmitted Airborne.
Weather and Wind
A key aspect of the spreading Airborne disease is the absence of rain and the direction of the wind blow. According to the data, the weather leading up to the epidemic of the illness was clear or cloudy, while the winds blew towards the East. This strengthened the Airborne theory dramatically.
Source of Propagation of Illness
The last leg to prove the theory is if a trigger for the illness could be identified. Since the suspected method of infection was Airborne, a keyword search was conducted to identify if any potential incident to the west of the infection site.
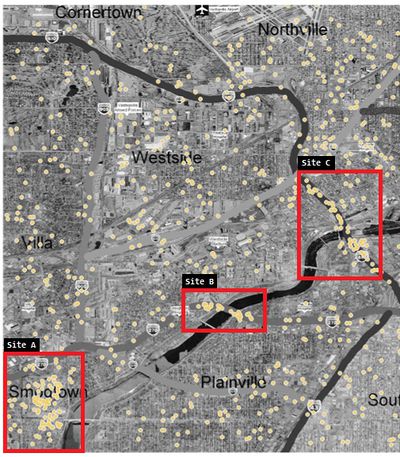
Through looking at indicators, like "fire", "explosion", "haze", and so on, which are signals of an Airborne transmission, 3 events were noted a day before the illness struck.
- Site A: Located to the south-west of the infection site, Site A identified an explosion and fire that broke out at a industry complex.
- Site B: Located west of the infection site, Site B featured an car that caught fire.
- Site C: Located just west of the infection site, Site C identified a tuck that caught fire.
While both Site B and Site C were events that could have caused the Airborne Epidemic, they were very unlikely cases as compared to that of Site A. According the the data, Site A was an industrial plant. Although the text does not specify the nature of the residue from Site A, Site A's profile matches that of one that could unleash harmful chemicals into the environment which could cause health hazards. Further evidence to suggest that Site A fits the profile was when massive amounts of smoke was reportedly released by the accident.
Conclusion to Hypothesis
While further evidence is required to confirm the findings, there is sufficient indirect evidence to suggest that the illness was an airborne agent that originated from the accident that happened in Smogtown when the industrial complex caught fire. The likely release of chemical agents into the atmosphere, together with the absence of rain to wash off the contaminant, as well as the west wind form the best explanation to the events on 18 May 2011.
Digestive Disorder Epidemic
Illness Discovery & Detection
A day after the incident, it was observed that there was an increase in the number of diarrhea and nausea cases along the aisles of the river heading towards Smogtown. The image below shows the number of new diarrhea cases on 18 May and 19 May.
The new cases were noted to be along the aisle of the river flowing between Plainville and Westside districts. The brought about the theory that water was the most likely cause of this epidemic by nature of its proximity to ther river.
Spread Theory & Validation Criteria
Conclusion to Hypothesis
Remedy & Action Plan
Through studying the data, it was apparent that a tremendous decline of new cases was experience on 19 May - as the figure above suggest. However, the figure below indicates that patients who have caught the illness are still suffering from it symptoms and would require further medical care. It should also be said, that there is insufficient evidence to comprehensively determine if the illness is chronic or life threatening.
The following list is the recommended actions to undertake with regards to the findings:
- Determine by-product released from the industrial explosion and its impact
- Monitor health conditions of the patients with suspected illness caused by explosion
- No requirement to quarantine since the illness shows no sign of peer-to-peer transmission
- Test Water supply and crop supply for safety of consumption. On the assumption that the illness was caused by the inhaling of harmful substances, we have to be mindful of the potential hazard that could occur when the particles settle. The consumption of these same substances would also be harmful and should be avoided.
