ISSS608 2017-18 T1 Assign ZHENG MIANYI
Contents
Background
An epidemic disease broke out in a major metropolitan area, Smartpolis. With provided information such as the city population, disease symptoms, both geographical map and weather of the city and most importantly: microblogs of the residents, I made every efforts to detect the transmission of this disease.
Tools
JMP Pro, Tableau and Excel.
Data Preparation
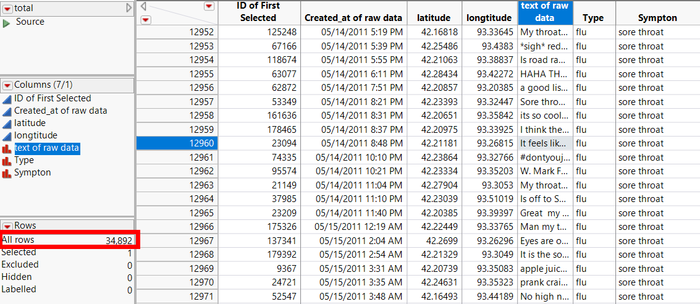
The initial dataset put the latitude and longitude data together, and the main information is contains in more than 1 million microblogs records. Hence, I separated the geographical digit to two columns, namely latitude and longitude.
Subsequently, I chose the key words to select the relevant information. Personally, I prefer a relatively small dataset with higher accuracy rather than a large dataset with lower accuracy. After many trials, I set the target words as:"fever", "chill", "fatigue", "cough", "difficult", "nausea", "vomit", "diarrhea", "lymph" and "throat".
Last but not lease, I attempted to explore more information. For instant, is there any initial symptoms before the patients becoming ill? In addition, after viewing the symptoms, we can initially group them into two main problems: flu (those with fever, chills, fatigue, coughing, breathing difficulty, sore throat and enlarged lymph nodes) and stomach problem (those with nausea, vomiting, diarrhea). All these two type of problems I stored them in "Type" column. In terms of symptoms, for those patient who suffered two kinds or above, i created the additional rows to store them in the "Symptom" column. (e.g. one record like " I got fever and my throat is on fire." will be recorded twice with "fever" tag and "sore throat" tag respectively.)
Broke Out
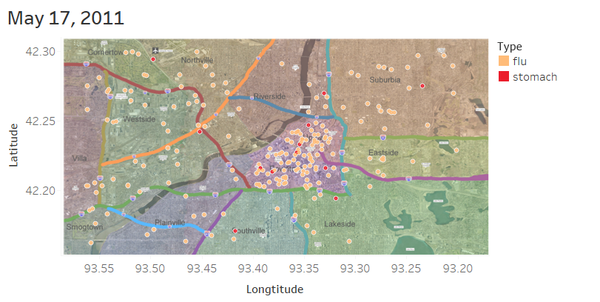
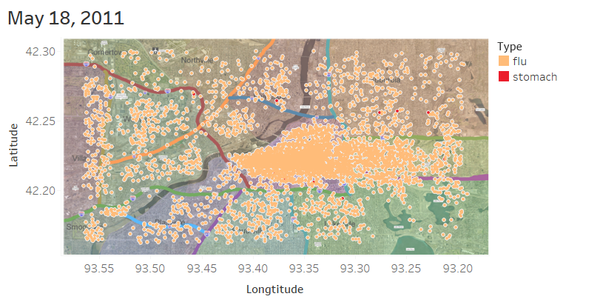
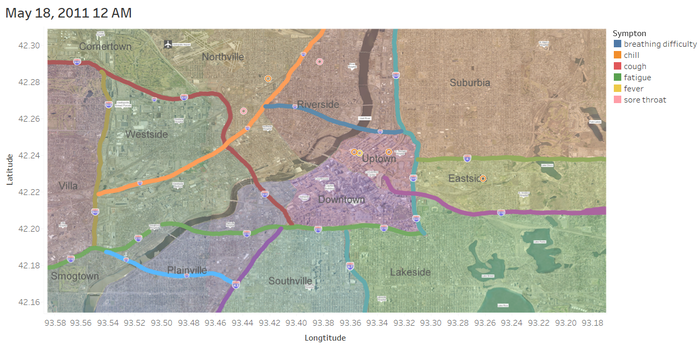
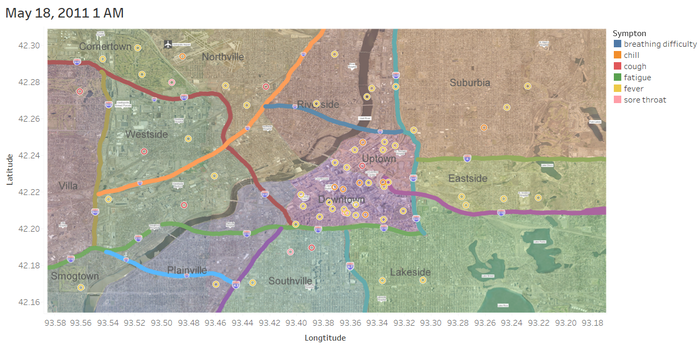
After I settled the right longitude and latitude digit in Tableau, I could easily find out the break out data by comparing the situation on 17 May with 18 May.The disease broke out on 18 May, especially in the city centre(uptown and downtown). Interestingly, most of these case were suffered flu.
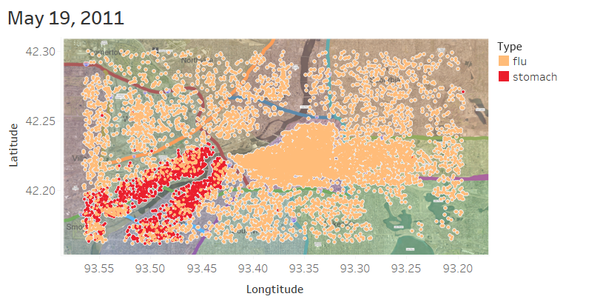
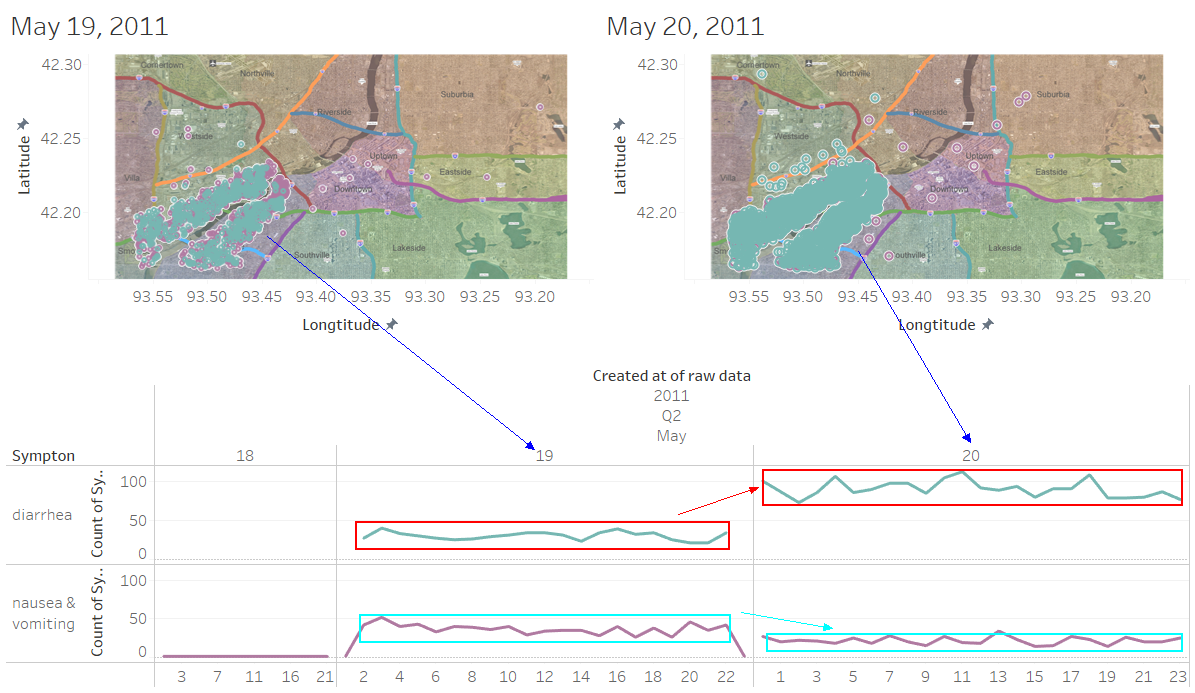
And the situation got even worse on 19 May, especially by the sides of river. However, it was apparent that those new case over two sides of river were stomach problem. At this point, we could draw a conclusion that those stomach cases are spread by the river.
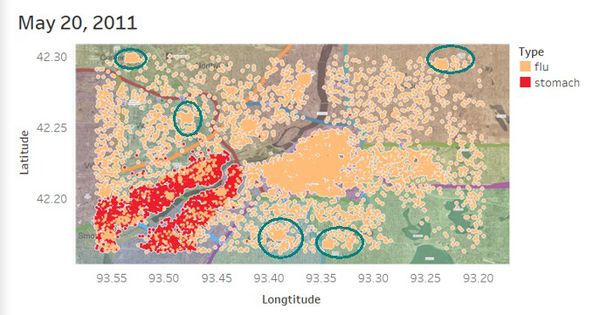
On 20 May, the last record day, the situation did not get better, but the pattern is changed. In general, if we look very carefully, we could notice that the flu patients in city centre decreased sightly while the stomach patients increased obviously. Meanwhile, except for the serious area like uptown and down as well as river side, the distribution of the case shown a circle pattern.
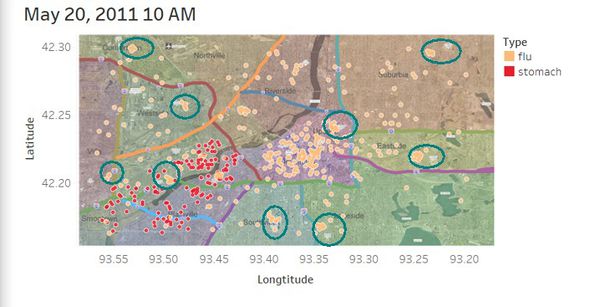
To be more precise, I selected the time by 10 am. on 20 May, the time when the people should go to world, and found out that many people went to hospital. Those who went to hospital were mostly flu patients.
Flu Symptoms
Since we just figure out there are two main type of disease, I will explore them separately.
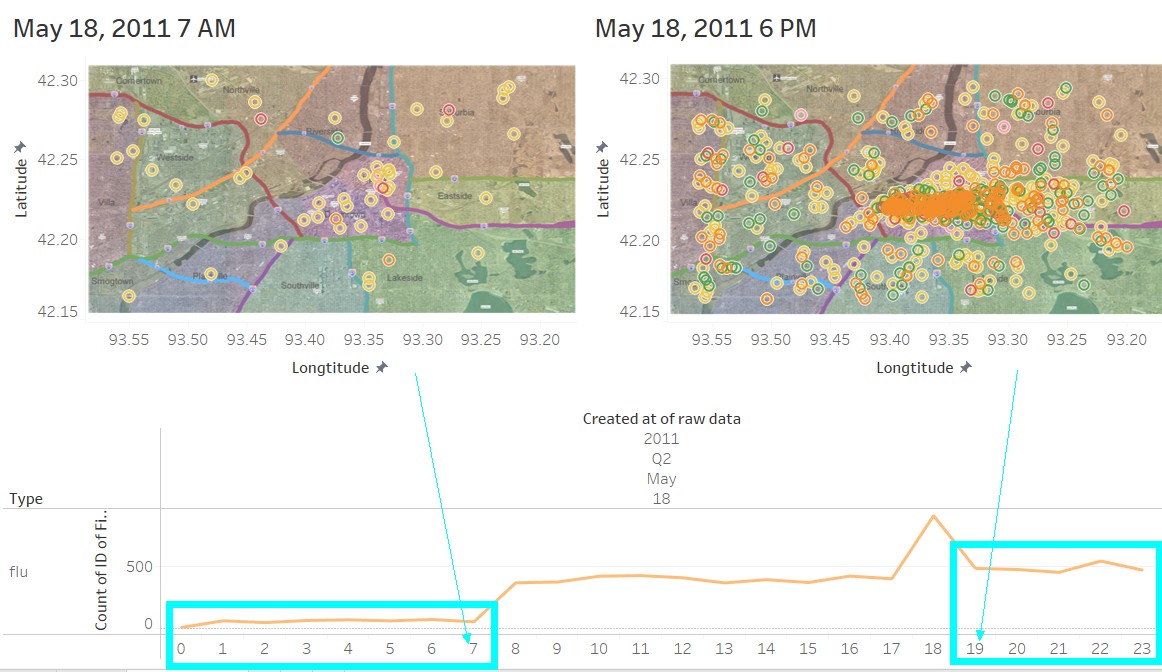
It was easy to figure out the exact time when the flu broke out. By comparing with the time on 18 May, we knew that the flu broke out at 1 am.
Initially, I thought that the fever patient would have some initial symptoms such as sore throat or chills. However, to my surprise, the flu broke out immediately without any initial sign. When I targeted at 7.am - 7.pm on 18 May, we could know that the flu breaking out at that time. By comparing the the time people at home (before 7.am and after 7.pm), we find the number increase significantly: from around 60 to around 500, approximately 9 time increase. At this stage, we could confidently draw a conclusion that the flu was spread via human-to-human transfer.
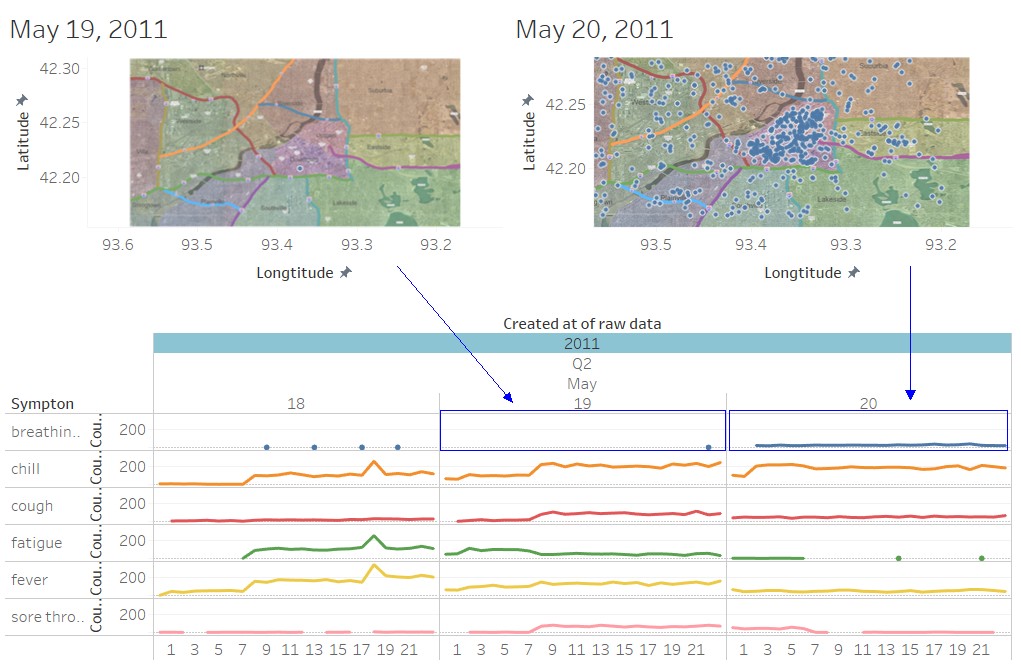
Is worth mentioning that till 20 May, most symptoms of flu dropped or stop increasing except for breathing difficulty. On the contrary, this symptom began at 2.am on 20 May. In addition, though the wind direction was provided, I did not have compelling proof to draw a conclusion that the wind should be responsible for the spread.
Stomach Symptoms
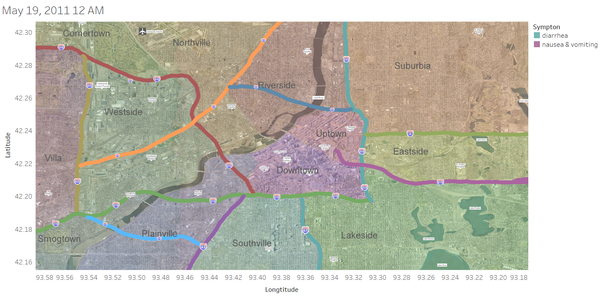
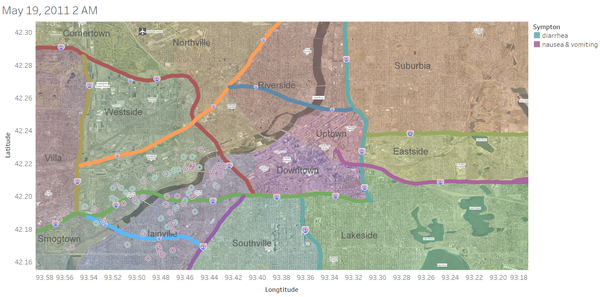
The Stomach Symptoms is different from the flu, it must be caused by other reason. The stomach symptoms broke out at 2.pm on 19 May.
I compared the symptoms between 19th and 20th May, it is obvious that the total number of stomach symptoms increased. When we went into details, we noticed that the diarrhea symptom rose dramatically (from 25 case/hour to 90 case/hour on average) while the nausea and vomiting symptoms dropped from 40 case/hour to 25 case/hour on average).
Summary
The disease actually was contains by two diseases, namely flu and stomach problem
In terms of flu, which spread via people-to people, broke out on 18 May in the city centre. This disease seemed to release on 20 May because most of the patient went to hospital. However, breathing difficulty began happen on 20 May which indicate that those who did not go to see the doctor would have a high chance to get worse. The government officer should pay attention to the situation.
Moving on the stomach problem, which spread by water, broke out on 19 May near the downstream of river. On the last record data, diarrhea symptom rose while the nausea and vomiting symptoms dropped. Government officer should immediately cut the use of downstream of water.
Limitation
On this task, I focus on the time series data analysis. However, since the trend of time is very apparent and I did not go into details on the districts and the population. If I made use of the "Lasso Selection" in Tableau, I could easily calculate the exact ratio of each symptom in each district to provide a more accurate overview of the epidemic. In addition, I tried to find out what even happened the "Smartpolis" city (maybe its real name is Vastopolis) but I failed.

