ISSS608 2017-18 T1 Assign Xiao Zhenyu Visualisation & Analysis
Mini Challenge 1: Smartpolis Epidemic Spread
| Background | Data Preparation | Design Methodology | Visualisation & Analysis | Tools |
Task 1. Origin and Epidemic Spread
The outbreak started from Eastside and CBD zone (Downtown and Uptown) as the infection cases reported showing a peak from the date and started to spread over and grow in the following days, while no such pattern found in the other areas. The affected area are Eastside, Downtown, Uptown, Suburbia, Lakeside, Southville, Plainville, Riverside, Westside, Villa, Smogtone, Northville, and Cornertown, with the largest number of infections in Eastside and CBD zone.
Conclusion are drawn from below detailed observations.
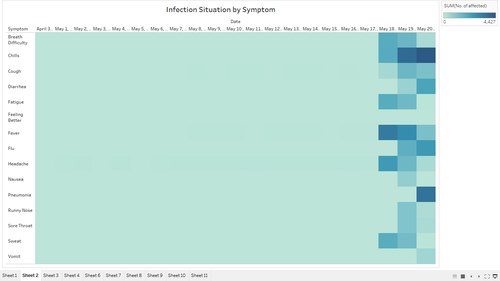
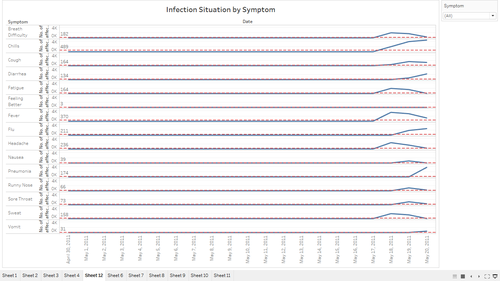
Observation 1 – Heatmap and Time Line View
• From 30 Apr to 17 May, the number of infections are relatively very small as indicated by the light blue colour.
• Staring from 18 May, there is an outbreak of some flulike symptoms indicated by strong blue colour and a sharp increase seen from the time line chart- chills (1,931 cases), breath difficulty (1,916 cases), cough (405), fever (3,384 cases), headache (2,439), fatigue (1,919 cases) and sweat (1,873 cases).
• On 19 May, the infection cases are growing and spreading over; 1,795 cases mentioned about flu; new symptoms like runny nose, sore throat, diarrhea, nausea surfaced with large number infections - chills (grows to 3,857 cases), breath difficulty (1,577 cases), cough (grows to 1,539), fever (2,867 cases), headache (1,500 cases), fatigue (1,471 cases) and sweat (1,411 cases); runny nose (1,093 cases), sore throat (1,094), diarrhea (628 cases), and nausea (765 cases).
• On 20 May, the diseases is still spreading over the whole city; new symptoms like Pneumonia surfaced with large number infections - chills (grows to 4,427 cases), cough (1,223), fever (1,237 cases), sweat (1,411 cases), flu (2,495 cases), diarrhea (2,142 cases); pneumonia (3,634 cases), vomit(510 cases)
Observation 2 – Satellite Map View
17 May 2011 Snapshot
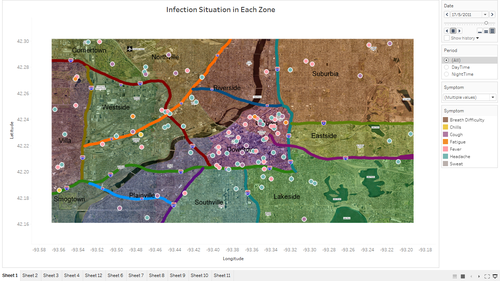
• On 17 May, it can be seen from the map that the infections are very few and spread sporadically in the map.
18 May 2011 Snapshot
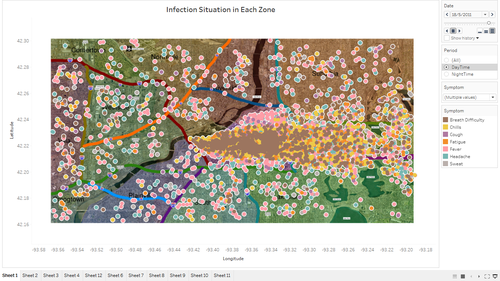
• On 18 May, it can be seen from the above map that in day time, the infections were mostly outbreak and concentrated in CBD and east zone i.e. Downtown and Uptown, and Eastside.
• Although other areas has much lesser contagious cases and spread all over each individual area, it shows a large growth compared with earlier date.
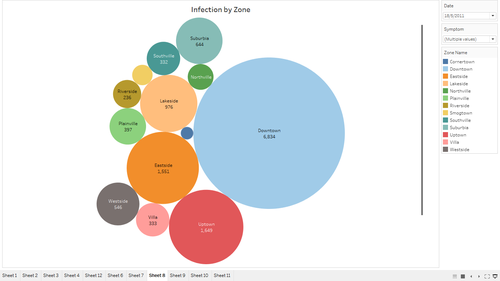
• On 18 May, it can be seen from the above bubble chart that CBD zone i.e. Downtown (Top 1) and Uptown (Top 2) followed by Eastside (Top 3) has the biggest number of infections compared with other zones.
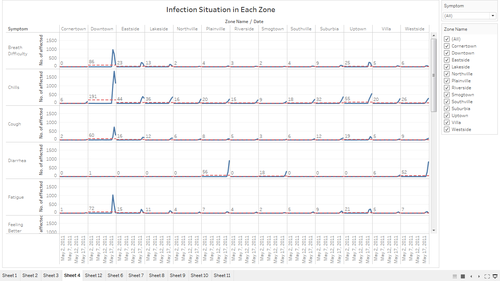
• On 18 May, it can also be seen from the above line chart that there is a breakout in CBD zone and eastside zone.
