ISSS608 2017-18 T1 Assign DENG CHUNLING
 Disease Outbreak Investigation
Contents
Objective & Methodology
In light of the serious situation that Smartpolis faces (several deaths reported!), I need to:
1. Source: Determine origin of disease outbreak
2. Spread: Find out medium of transmission
3. Control: Suggest measures to contain spread
My approach to this problem is:
| Action Step | Result |
|---|---|
| Filter blog text for spots of flu | Exclude non-disease blogs from analysis |
| Determine type of symptoms | Categorise symptoms into water, air or human |
| Correlate spots with map and time | Animate disease outbreak path by timelapse |
| Drill down into water-borne | Study the origin, spread and contributing factor |
| Drill down into air-borne | Study the origin, spread and contributing factor |
| Drill down into human-transmitted | Study the origin, spread and contributing factor |
So that I can suggest containment measures and geo-fencing for each of the transmission type.
Data Preparation
Efforts are needed to transform the "Microblog" dataset into a format that is conducive for visualization.
| Variable | Treatment | Description | Screenshot |
|---|---|---|---|
| Location | Break into "Lat" and "Lon" respectively | SAS EG workflow to prepare Lat/Lon and save to library |  |
| Text | Find stemmed words from text | SAS EM workflow to extract stemmed words from library. This will help avoid fuzzy lookup e.g. I search for "ache" but "mustache" is returned |  |
| Text | Filter microblogs to only pre-defined symptoms | SAS EG workflow to join documents and words list. Note that these are all stemmed words so whatever forms of words are in the microblogs, even misspelled ones, will be detected.  |
 |
| Symptom | Group symptoms into 3 broad categories: related to digestive system, respiratory system or muscle. The rationale is that some people may know that they have flu, but others are just describing the symptoms. |  |
ddd |
Origin and Initial Spread
My Tableau visualization below allows me to look at the disease situation in a multi-dimensional view.
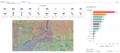
Overall Disease Investigation
Daily Disease Dashboard

We can see from the Overall Dashboard, by filtering the date value one by one, that the flu outbreak happens on 18 May 2011. This is confirmed by another dashboard which shows the day-by-day view by more clearly. 18 May is also the day where we see a lot of symptoms coming out, from a mere hundred to a few thousand microblogs.
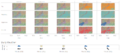
| 17 May | 18 May |
|---|---|
 |
 |
Comparing these two days, we know two things. First, the source of this flu originated from the downtown area, and initially it spread to the east. We see that this initial spread is along one of the water pipe, whereas the wind direction on 18 May is to the west. This is the indication that the initial spread is due to water-borne factors, not air-borne, because the wind direction is opposite the spread direction.
Transmission and Containment
Following the initial spread on 18 May, we see another outbreak on 19 May, but this time with very interesting characteristic.
| 18 May | 19 May |
|---|---|
|
 |
We see that the complaints of nausea and diarrhea increases very rapidly, especially along the river in Westside, Plainsville and Smogtown. The wind direction on 19 May is North West, so we are very confident that this second surge in disease outbreak is due to water-borne factor again - not along the water supply, but rather the river itself.
Transmission Medium - Water, Air or Human Interaction?
Containment Suggestions
Next let's look at the time trend.

Link to Tableau Page
Feel free to access and comment on my visualization project here:
https://public.tableau.com/profile/deng.chunling#!/vizhome/cldeng_2016/DiseaseControl?publish=yes