ISSS608 2017-18 T1 Assign FOO CELONG RAYMOND/Hypothesis
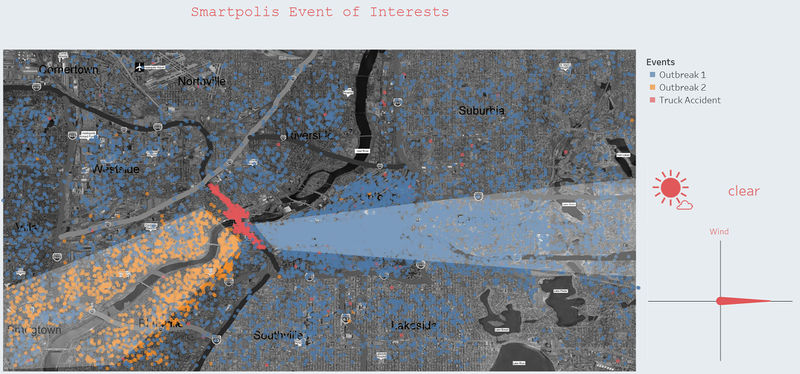
From the preliminary analysis and in the process of identifying the ground zero, I discovered that there are two clear sets of symptoms belonging to two different outbreaks and the initial outbreak is a point source outbreak. I hypothesize that these two outbreaks are cause by a single incident on 17-May along highway 610 that occurred after the bridge to downtown. This report will identify the 3 factors of the transmission model (agent, host, environment) and provide evidence to support the claims.
The hypothesized series of event is as follows:
| 17-May | : | Accident occurs along highway 610 towards downtown |
| 17-May | : | Agent is introduced into the air and high concentration of the agent is blown eastward exposing hosts in the area |
| 17/18-May | : | Agent contaminates water along vast river either through diffusion into water, chemical reaction with the water or direct spillage of contaminants into the water body and thereby exposing hosts living downstream that rely on the river for their water supply |
| 18-May | : | Technology convention held at the convention center at uptown which exposed additional people to the agent |
| 18-May | : | Hosts infected by the airborne agent start to report their symptoms |
| 19-May | : | Hosts infected by the waterborne agent start to report their symptoms |
| 20-May | : | Reduction in respiratory symptoms which may be because the concentration of the agent in the air has diffused to a lower amount. |
Two clear sets of symptoms belonging to two different outbreaks are identified and each set belongs to a different class of disease. The symptoms supports the hypothesis that the first outbreak is an airborne transmission while the second outbreak is a water bourne transmission.
| Incubation Period | Class of Disease | Likely Transmission Method | Symptoms | |
|---|---|---|---|---|
| 18-May outbreak | ~1 Day | Respiratory | Air Borne |
|
| 19-May outbreak | 1-2 Day | Gastrointestinal | Ingestion |
|
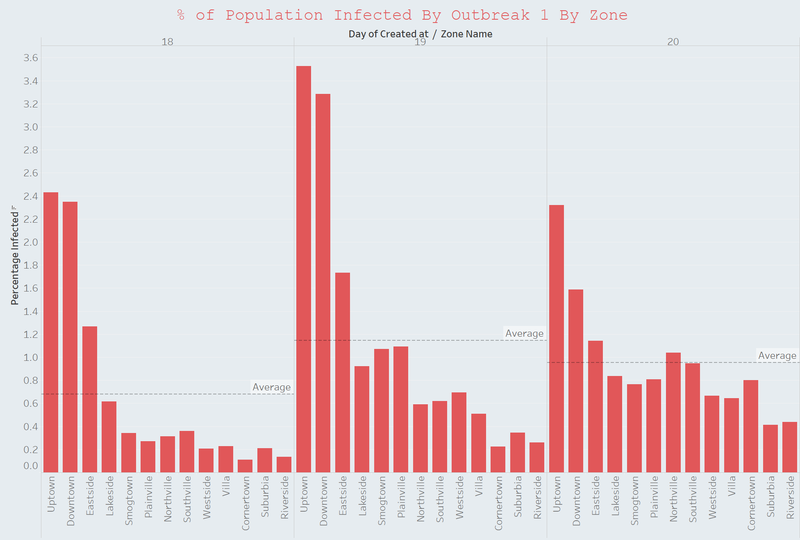
Although I identified downtown as the ground zero of the first outbreak, plotting the percentage of population that posted about the disease show that uptown has a higher percentage of its population showing symptoms. This seems to imply that although there are more people infected in downtown, the uptown's population is slightly more susceptible to the agent.
The distribution of the newly reported cases over time is also in agreement that this is an air borne agent. The data show that the initial the areas east of downtown (including downtown) are the most severely affected. But over a period of 2 days time, the distribution across all zone not only becomes more uniform but has also reduced on average. This is in agreement to the hypothesis that initial those area has high concentration of the agent due to wind condition but the concentration will be spread out across the whole region via diffusion.
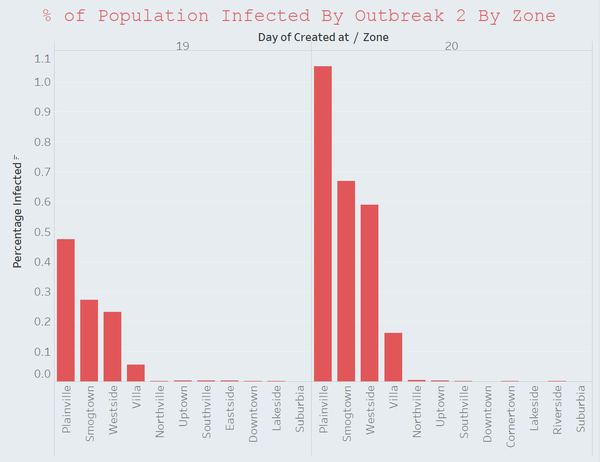
For the second outbreak, only 3 city zones are affected. All 3 regions (smogtown, plainville and westside) share border with the vast river and draws water from the river for their water supply. This also supports the hypothesis of a water borne agent that contaminated the downstream from bridge at highway 610.
The environment factor focuses on how the agent gets introduced to the host's environment. In the case of the first outbreak, the wind was blowing eastward which caused a higher number of cases of infection in that direction. The second outbreak is aided by the flow of the river downstream and eventually get introduced into the host's food and water supply.


