ISSS608 2017-18 T1 Assign ZHANG LIDAN
Revision as of 16:28, 15 October 2017 by Lidan.zhang.2016 (talk | contribs)
|
|
|
|
|
Background
Motivation
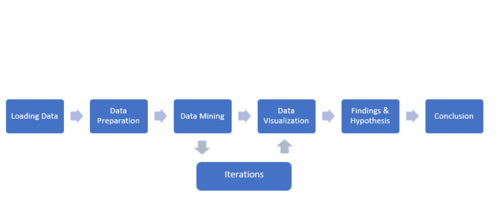
During the past few days, there is a sharply increase in reported illness from local hospitals in Vastopolis City. To better assist the city official in look in mitigating the bad effect from these symptoms. I prepare to explore what happens according to the comments from the microblog and weather and events from the given datasets.
About Dataset
There are 3 datasets given in csv format. Here, I mainly focus on the Microblog dataset at first.
Tools Application
I use JMP to do the data pre-processing, then plot the data by using Tableau.

