From Visual Analytics and Applications
Jump to navigation
Jump to search

Vastropolis Epidemic Report
Microblog
1. Data cleaning
| Description
|
Illustration
|
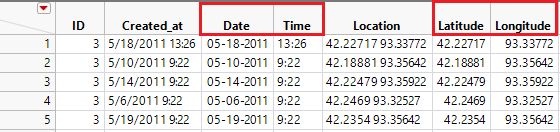
1. Split of Columns
- Created_at column is splitted to Date and Time columns. Date column is used in other analytics.
- Also, Location column is splitted to Latitude and Longitude columns. These data is used to plot in Vastropolis map.
|
|
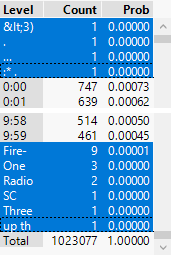
2. Outliers
- There are 21 items with invalid time format. They are removed from analysis.
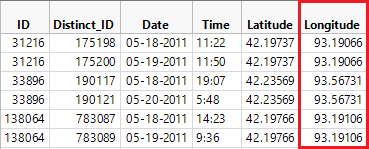
- Also, there are 6 items with Longitude outside of given map range. They are removed as well so that all data are within parameters.
- Total 27 rows are removed and 1,023,050 rows are used for analysis.
|
|


