Difference between revisions of "ISSS608 2017-18 T1 Group6 Report"
| Line 26: | Line 26: | ||
== MOTIVATION == | == MOTIVATION == | ||
| + | <p align="justify">On Nov 4th, Beijing Environmental Protection Agency released the news, owing to the adverse weather conditions and early winter heating as well as other factors, it is expected that there will be a continuous 4-day regional heavily polluted air quality in Beijing-Tianjin-Hebei and surrounding areas on November 4th, in addition, the air quality in some cities may reach serious pollution level….</p> | ||
| + | <p align="justify">“Why is China’s smog so bad now?”, a lot of people from overseas want to explore. With the rapid development of economy in China, news from China is more frequently commented in the globe. China’s air pollution has been a serious issue for more than 10 years, with the problem appealing more attention worldwide, the Chinese government has make big efforts to solve it.</p> | ||
| + | [[image: air4.jpg|300px|center]] | ||
| + | <p align="justify">China's capital Beijing is under pressure to bring average PM2.5 readings to 60 micrograms per cubic meter this year, which has decreased from 73 micrograms since last year. Nonetheless, the index is still higher than the official air quality standard value in China Mainland.</p> | ||
| + | <p align="justify">Along with the increasing escalation of air pollution, most people who are working and living in Beijing are faced with the tracheitis, pneumoconiosis, asthma, to name just a few. Nowadays, current air quality fails to meet people's expectation. Gradually, a lot of people are terrified with living and working in Beijing.</p> | ||
| + | <p align="justify">In our project, we mean to apply the visual analytics tools to better visualize the changes of air quality according its existing indicators. We will show the fluctuation of the historical AQI (Air Quality Index), the pollutant concentrations and trend charts by pollutants in the different view point in Beijing. We hope that we can try our best to show the weather condition, make people clearly know more about the surroundings they are living in as well as raise the public awareness of environmental protection.</p> | ||
| + | |||
== REVIEW AND CRITIQUE OF PRIOR WORK == | == REVIEW AND CRITIQUE OF PRIOR WORK == | ||
== DATA PREPARATION == | == DATA PREPARATION == | ||
Revision as of 15:56, 30 November 2017
|
|
|
|
|
Contents
MOTIVATION
On Nov 4th, Beijing Environmental Protection Agency released the news, owing to the adverse weather conditions and early winter heating as well as other factors, it is expected that there will be a continuous 4-day regional heavily polluted air quality in Beijing-Tianjin-Hebei and surrounding areas on November 4th, in addition, the air quality in some cities may reach serious pollution level….
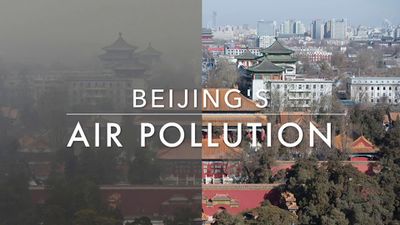
“Why is China’s smog so bad now?”, a lot of people from overseas want to explore. With the rapid development of economy in China, news from China is more frequently commented in the globe. China’s air pollution has been a serious issue for more than 10 years, with the problem appealing more attention worldwide, the Chinese government has make big efforts to solve it.
China's capital Beijing is under pressure to bring average PM2.5 readings to 60 micrograms per cubic meter this year, which has decreased from 73 micrograms since last year. Nonetheless, the index is still higher than the official air quality standard value in China Mainland.
Along with the increasing escalation of air pollution, most people who are working and living in Beijing are faced with the tracheitis, pneumoconiosis, asthma, to name just a few. Nowadays, current air quality fails to meet people's expectation. Gradually, a lot of people are terrified with living and working in Beijing.
In our project, we mean to apply the visual analytics tools to better visualize the changes of air quality according its existing indicators. We will show the fluctuation of the historical AQI (Air Quality Index), the pollutant concentrations and trend charts by pollutants in the different view point in Beijing. We hope that we can try our best to show the weather condition, make people clearly know more about the surroundings they are living in as well as raise the public awareness of environmental protection.

