Difference between revisions of "ISS608 2017-18 T1 Assign KyonghwanKim Visualization"
Kh.kim.2016 (talk | contribs) |
Kh.kim.2016 (talk | contribs) |
||
| Line 40: | Line 40: | ||
[[file:population.png|700px]]<br/> | [[file:population.png|700px]]<br/> | ||
| − | '''''Box plot with area, population density, and floating population''''' | + | '''''Box plot with area, population density, and floating population'''''[https://public.tableau.com/profile/kyonghwan.kim#!/vizhome/Book1_24755/Sheet2] |
It is straight forward that area ''Suburbia'' has the largest population followed by ''Lakeside'' and ''Riverside'' whereas area ''Uptown'' has the largest floating population followed by ''Downtown'' and ''Westside''. Also, all of top '''7''' areas have negative floating population, meaning people are travelling to ''Uptown'', ''Downtown'' and ''Westside'' everyday for work. | It is straight forward that area ''Suburbia'' has the largest population followed by ''Lakeside'' and ''Riverside'' whereas area ''Uptown'' has the largest floating population followed by ''Downtown'' and ''Westside''. Also, all of top '''7''' areas have negative floating population, meaning people are travelling to ''Uptown'', ''Downtown'' and ''Westside'' everyday for work. | ||
| Line 58: | Line 58: | ||
=Key Words Analysis= | =Key Words Analysis= | ||
| + | |||
Following key words are used for analysis. | Following key words are used for analysis. | ||
| Line 71: | Line 72: | ||
|} | |} | ||
| − | Using above key words, text traffic is plotted into Vastropolis map. | + | |
| + | |||
| + | Using above key words, text traffic is plotted into Vastropolis map.[https://public.tableau.com/profile/kyonghwan.kim#!/vizhome/VistropolisFlu/Sheet2?publish=yes][https://public.tableau.com/profile/kyonghwan.kim#!/vizhome/VistropolisCold/Sheet1?publish=yes][https://public.tableau.com/profile/kyonghwan.kim#!/vizhome/VistropolisSymptom/Sheet5?publish=yes] | ||
{| class="wikitable" | {| class="wikitable" | ||
Latest revision as of 23:39, 15 October 2017
Vastropolis Epidemic Report
|
|
|
|
|
|
Population
Population data has Daytime_Population and Population_Density by area. Using these 2 variables, "Floating_Population" variable is created by taking Population_Density away from Daytime_Population.
"Floating_Population" represent how many people are moving into each area as well as moving out after work.
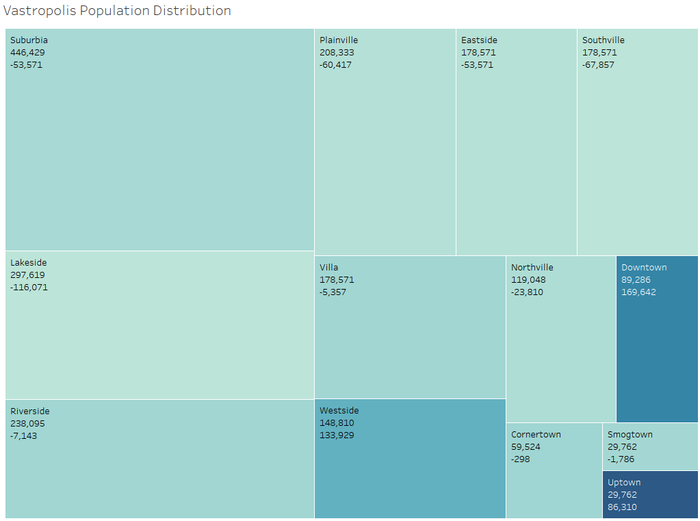
Box plot with area, population density, and floating population[1]
It is straight forward that area Suburbia has the largest population followed by Lakeside and Riverside whereas area Uptown has the largest floating population followed by Downtown and Westside. Also, all of top 7 areas have negative floating population, meaning people are travelling to Uptown, Downtown and Westside everyday for work.
Weather
Wind speed and direction are presented below.

Heatmap of wind speed and direction
Wind direction has changed from South/East to North/West from May 4th. It gets very strong from May 3rd till May 8th, and get strong again from May 11th onward.
Key Words Analysis
Following key words are used for analysis.
| Diagnosis | flu, cold |
| Symptoms | fever, chill, sweat, pain, fatigue, cough, breathing difficulty, nausea, vomit, diarrhea, headache, sick, shortness of breath, declining health, hurts to move, aching muscles, sore throat, runny nose, problems breathing, pneumonia |
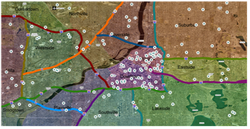
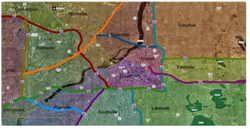
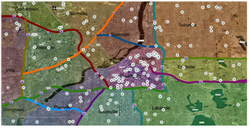
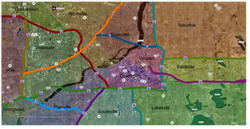
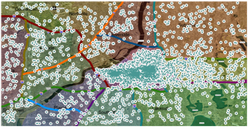
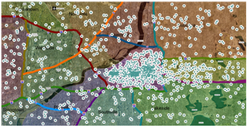
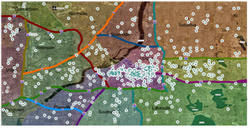
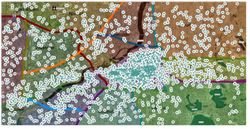
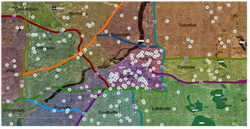
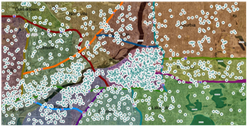
Using above key words, text traffic is plotted into Vastropolis map.[2][3][4]
| Date | Flu | Cold | Symptoms |
| May 16th | 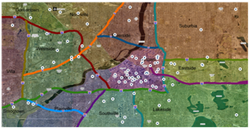
|
|
|
| May 17th | 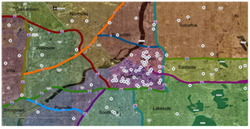
|
|
|
| May 18th | 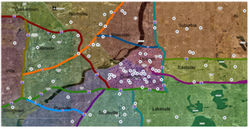
|
|
|
| May 19th | 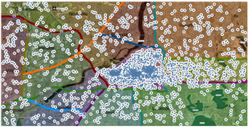
|
|
|
| May 20th | 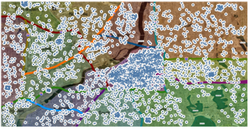
|
|
|
Above series of plot in Map shows following points.
- Frequency of text cold leap up on May 18th whereas frequency of text flu remain clam on same day. Cold is less likely used for diagnosis, but is likely used to describe temperature.
- Frequency of text Symtom leap up on May 18th, then text flu leap up on following day. People describe their contagion symptoms 1 day before writing flu.
- Frequency of text cold decreased on May 19th. It may referring the temperature of Vastropolis warm up again.

