Difference between revisions of "ISSS608 2017-18 T1 Assign KARAN JYOTI KHANNA"
| Line 34: | Line 34: | ||
I inserted the Smartpolis_Map as a background image for the dataset in Tableau. | I inserted the Smartpolis_Map as a background image for the dataset in Tableau. | ||
| + | |||
| + | === Ground Zero Location & Time === | ||
X axis = Longitude | Y axis = Latitude | X axis = Longitude | Y axis = Latitude | ||
| Line 50: | Line 52: | ||
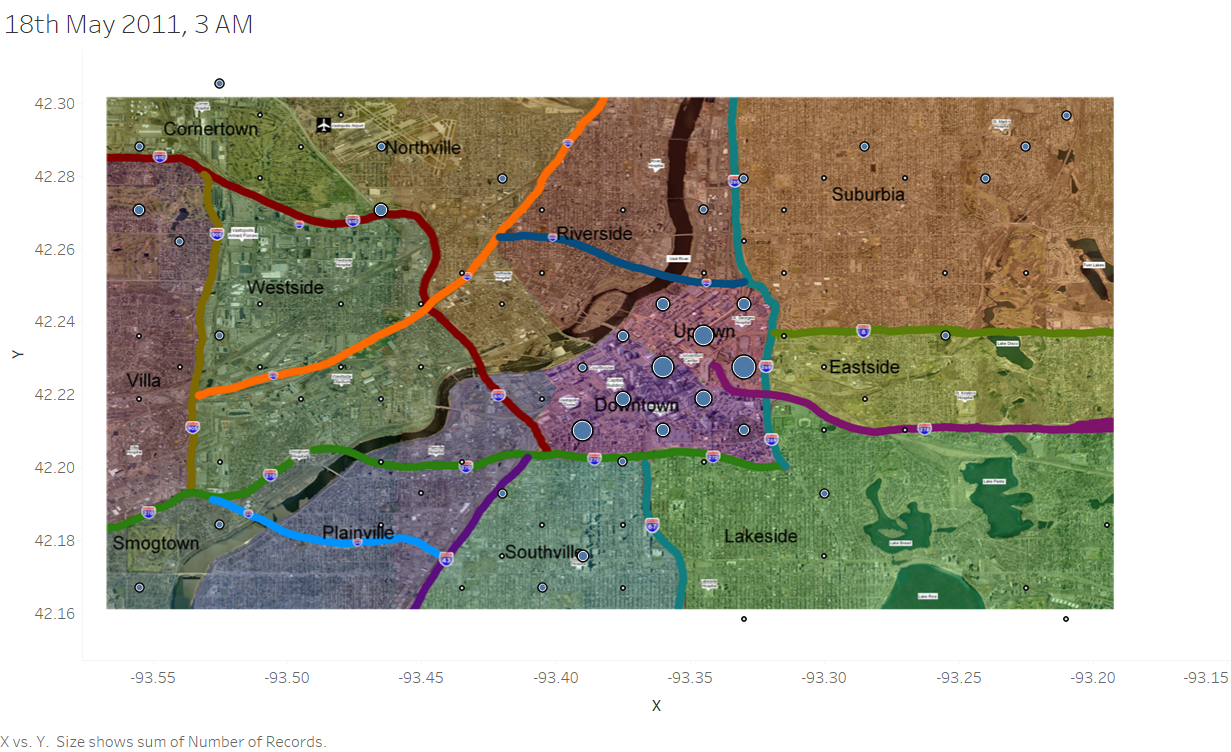
From the above visualization, it can be safely concluded that the outbreak initialized between midnight and 3 AM on the 18th of May, 2011. | From the above visualization, it can be safely concluded that the outbreak initialized between midnight and 3 AM on the 18th of May, 2011. | ||
| + | |||
| + | === Mode of Transmission === | ||
| + | |||
| + | ==== Airborne ==== | ||
| + | |||
| + | [[File:05. Viz 05.png|none|Viz 04]] | ||
| + | |||
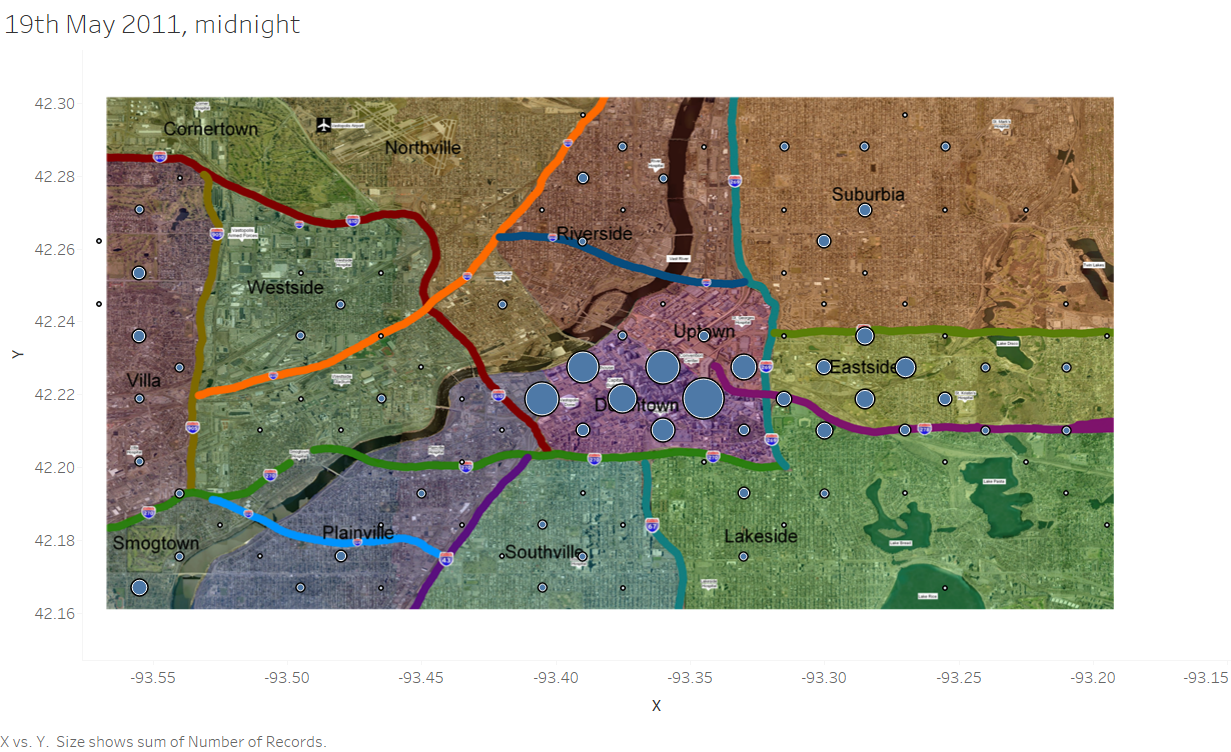
| + | Using the dataset Weather.csv, we can clearly observe that wind was going in the direction of the west on the 18th of May. Had the mode of transmission been air, we would have expected that the population living in the Eastside area and parts of Suburbia, as well as Lakeside to have experienced the disease too. But from the above visualization- taken on May 18, 11:30 PM, we cannot see any increase in the number of tweets from the previously mentioned areas. Comparing the number of observations from for example, Suburbia and Eastside with those from Downtown and Uptown- we can see the large difference. Therefore, it can be safely ruled out that the mode of transmission was not air. | ||
Revision as of 06:17, 6 November 2017
Contents
About Smartpolis
Smartpolis is a big metropolitan city with a population of around 2 million people. In the past few days, doctors and nurses in the hospitals of Smartpolis have monitored a significant increase in admits.
The initial observation is the commonality of flu-like symptoms such as chills, sweats, headaches, pains, fever, fatigue, breathing issues, vomiting, diarrhea, among others. Because of this, a number of deaths have been associated with the outbreak of flu within the city. Smartpolis governors are worried about an epidemic, and want to boost emergency medical resources to minimize the impact.
Two datasets have been provided. The first one contains microblog messages collected from various devices with GPS capabilities. These devices include laptop computers, handheld computers, and cellular phones. The second one contains map information for the entire metropolitan area. The map dataset contains a satellite image with labeled highways, hospitals, important landmarks, and water bodies. Supplemental tables for population statistics and observed weather data are also provided.
We have been provided with 2 data-sets. One with microblogging platform tweets collected from many GPS enabled devices. They include laptop computers, handheld computers and mobile phones. The other data-set contains map coordinates for the whole of Smartpolis. We are also given an image with marked highways, hospitals, important landmarks and water bodies. Additionally, tables for population statistics are also available at our disposal.
The objective of this project:
- Find the ground-zero location on the map image provided, carve the affected area and enlist the corresponding conclusion.
- Apply a theory to how the flu is being transmitted in Smartpolis ie. the mode of spreading of the flu. For example, airborne, waterborne etc. Support this theory with proof.
- Assess if the flu transmission is immutable and also if it's important for the Smartpolis emergency management officials to boost treatment services outside of the affected areas. Support your statement with proof.
Data Preparation
Within the dataset 'Microblogs.csv', we have been provided with attributes ID, Created_at, Location and Text. For the Location attribute, it is important to separate the X and Y coordinates, into longitude and latitude respectively. I used Excel to do this.
After doing the above, I imported the dataset into SAS JMP Pro.
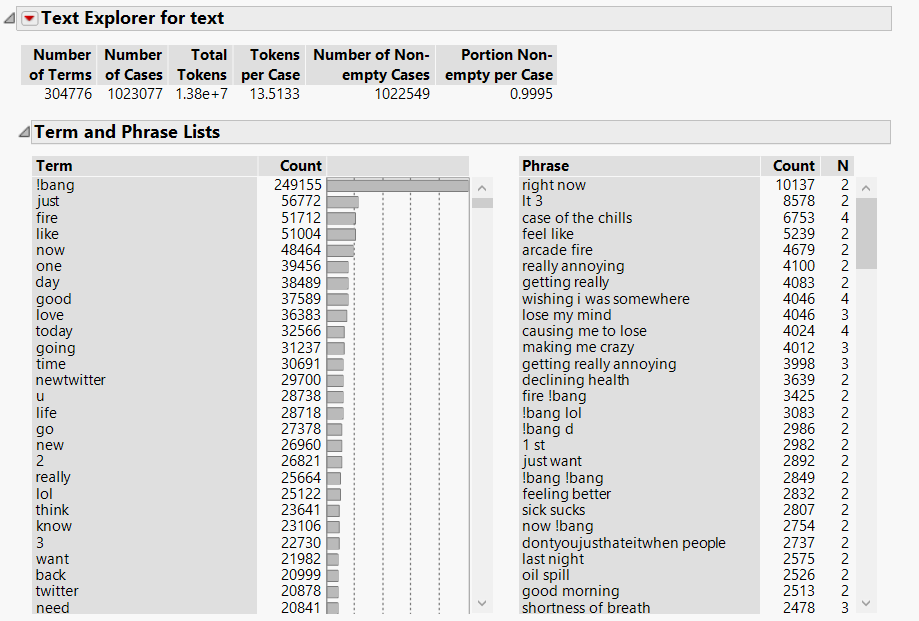
In SAS JMP Pro, I used the Text Explorer function to assess key terms and phrases to be used for further analysis.
As can be seen in the image, the relevant records considering the phrases and terms of symptoms (headache, fever, sick sucks etc.) have been reduced down from 1,023,077 to only 66,727.
Also, in Excel, I changed the X axis (Longitude) values to reflect to be negative, as has been prescribed in the README word document.
Data Visualization
Next, I imported the SAS derived Excel sheet into Tableau.
I inserted the Smartpolis_Map as a background image for the dataset in Tableau.
Ground Zero Location & Time
X axis = Longitude | Y axis = Latitude
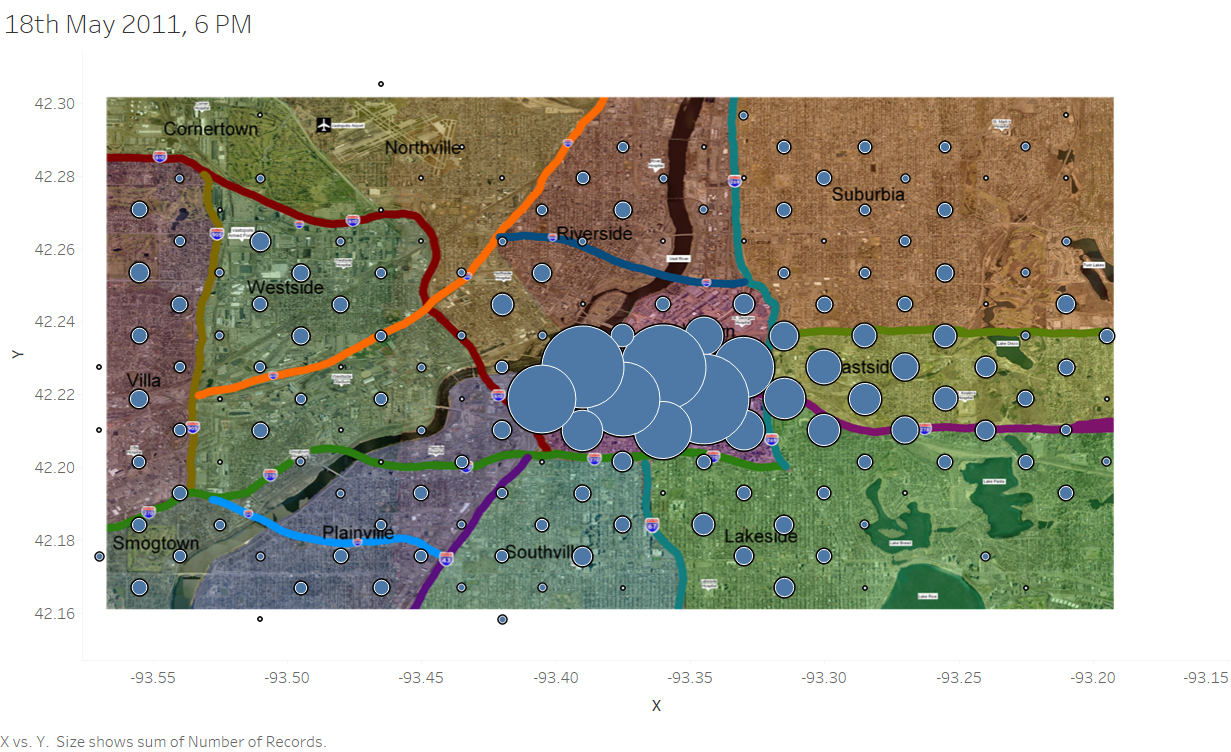
We can see above that there are a lot of observations around the middle part of Smartpolis. Therefore, from this, it can be safely concluded that the outbreak started from the central area of Smartpolis, namely Downtown and Uptown.
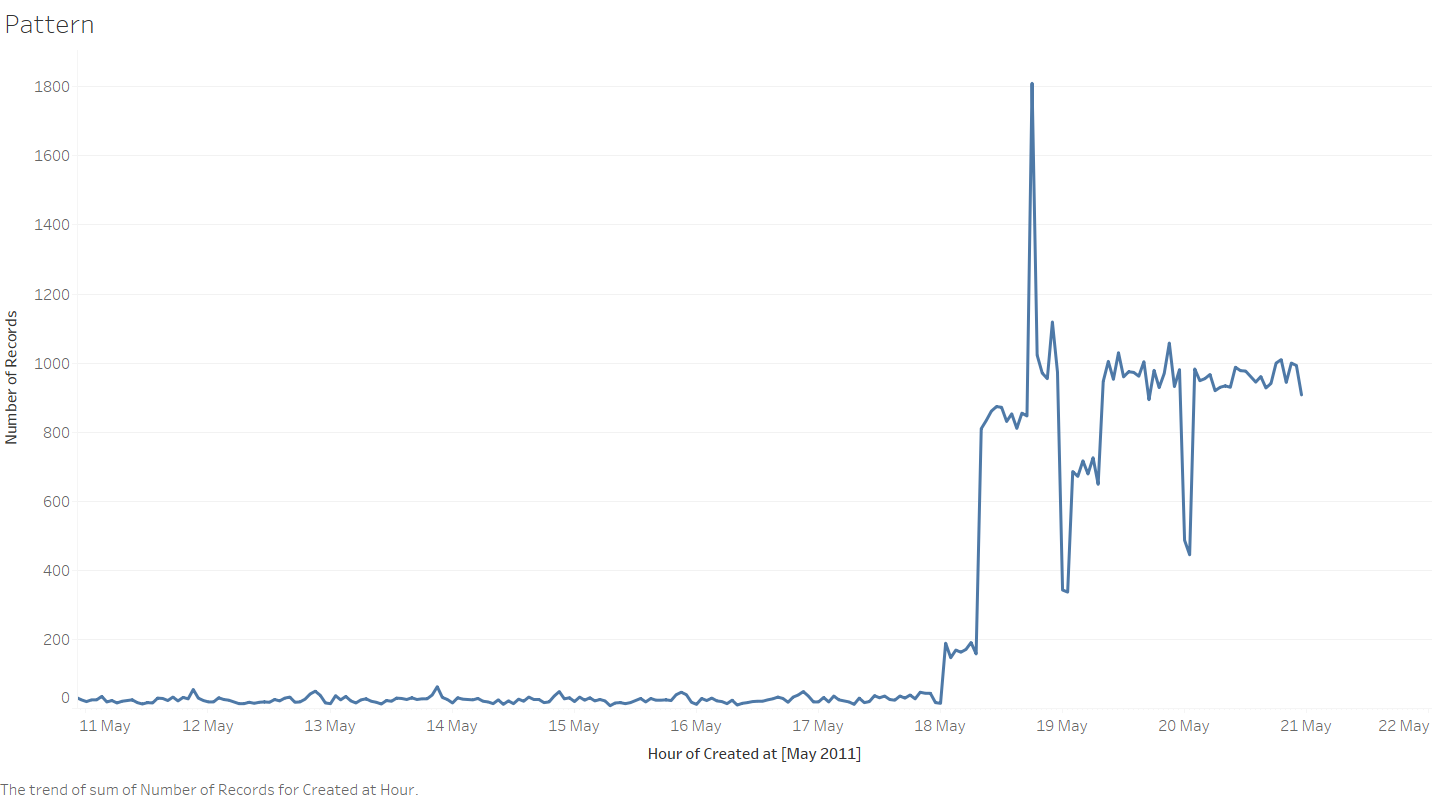
From the above visualization, it is clear to us that the outbreak started on the 18th of May, 2011.
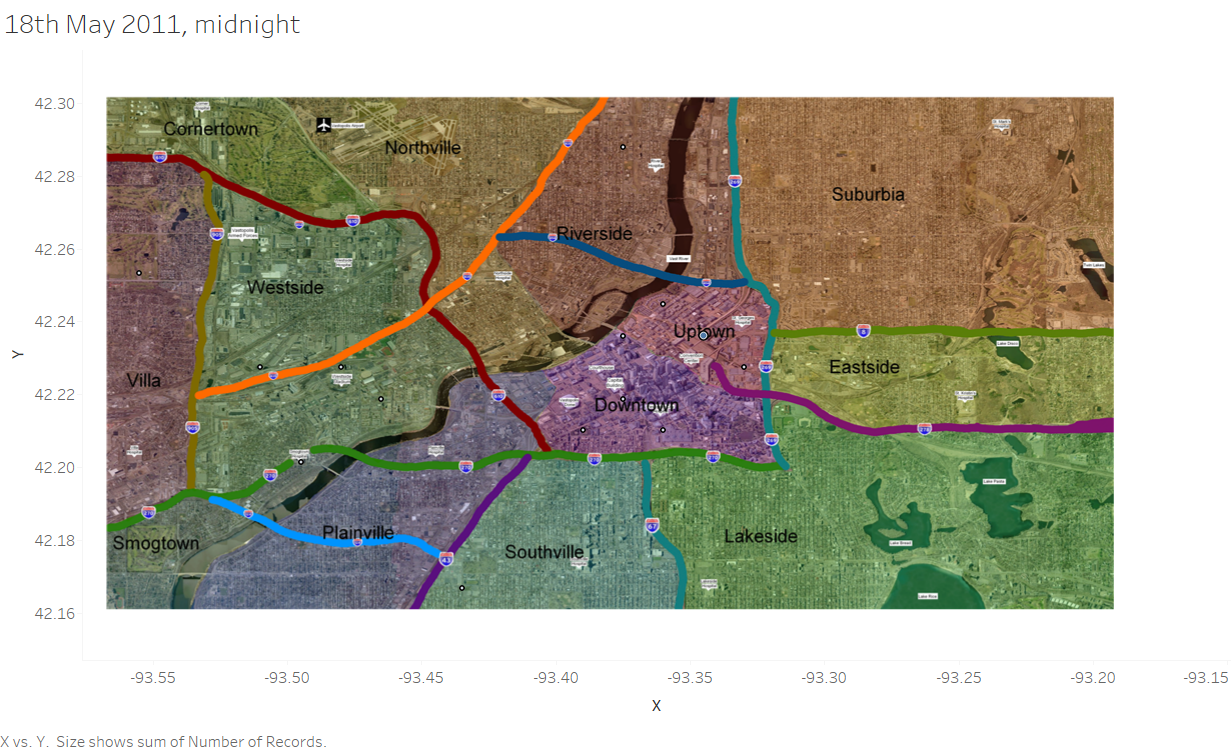
From the above visualization, it can be safely concluded that the outbreak initialized between midnight and 3 AM on the 18th of May, 2011.
Mode of Transmission
Airborne
Using the dataset Weather.csv, we can clearly observe that wind was going in the direction of the west on the 18th of May. Had the mode of transmission been air, we would have expected that the population living in the Eastside area and parts of Suburbia, as well as Lakeside to have experienced the disease too. But from the above visualization- taken on May 18, 11:30 PM, we cannot see any increase in the number of tweets from the previously mentioned areas. Comparing the number of observations from for example, Suburbia and Eastside with those from Downtown and Uptown- we can see the large difference. Therefore, it can be safely ruled out that the mode of transmission was not air.
