Difference between revisions of "Group 4 Data Prep"
Jump to navigation
Jump to search
Summary of data-set used
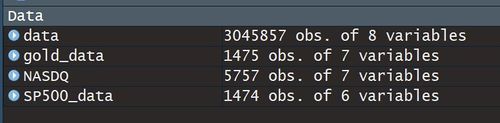
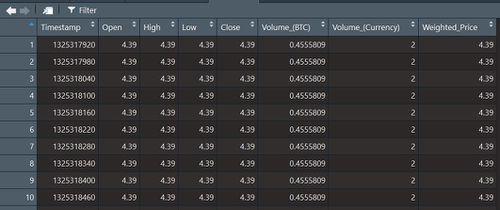
Bitcoin Data
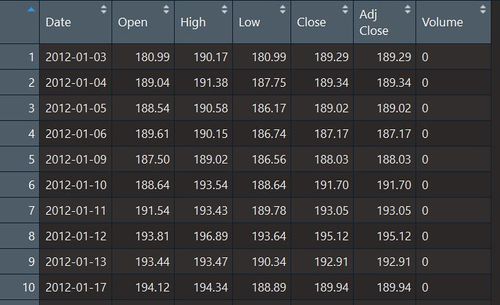
Gold Price Data
Nasdaq Index
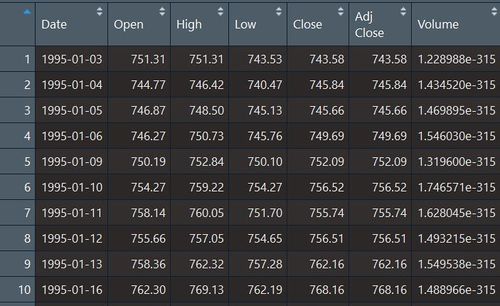
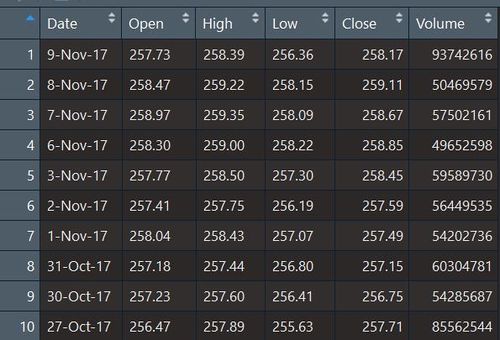
S&P 500
Ytdeng.2016 (talk | contribs) |
|||
| (2 intermediate revisions by one other user not shown) | |||
| Line 31: | Line 31: | ||
<font size = 4><span style="font-family:Century Gothic;font-weight:500;padding-bottom:1px; border-bottom: solid 1px black;">Data source and preparation</span></font> | <font size = 4><span style="font-family:Century Gothic;font-weight:500;padding-bottom:1px; border-bottom: solid 1px black;">Data source and preparation</span></font> | ||
| − | The following are the data used | + | The following are the data sets used |
# Per minute bitcoin price data, extracted from Kaggle: https://www.kaggle.com/mczielinski/bitcoin-historical-data | # Per minute bitcoin price data, extracted from Kaggle: https://www.kaggle.com/mczielinski/bitcoin-historical-data | ||
# Nasdaq index: https://finance.yahoo.com/quote/%5EIXIC/history?ltr=1 | # Nasdaq index: https://finance.yahoo.com/quote/%5EIXIC/history?ltr=1 | ||
| Line 41: | Line 41: | ||
The following are screenshots of the original data imported | The following are screenshots of the original data imported | ||
| − | Summary | + | <center style="font-size:15px;"> <u>''Summary of data-set used''</u> </center> |
| − | + | [[File:Summary.jpg|500px|center]] | |
| − | [ | ||
| − | '' | + | <center style="font-size:15px;"> <u>''Bitcoin Data''</u> </center> |
| − | [ | + | [[File:Bitcoindataframes.jpg|500px|center]] |
| − | '' | + | <center style="font-size:15px;"> <u>''Gold Price Data''</u> </center> |
| − | [ | + | [[File:Golddata.jpg|500px|center]] |
| − | '' | + | <center style="font-size:15px;"> <u>''Nasdaq Index''</u> </center> |
| − | [ | + | [[File:Nasdaq.jpg|500px|center]] |
| + | |||
| + | <center style="font-size:15px;"> <u>''S&P 500''</u> </center> | ||
| + | [[File:Sp500data.jpg|500px|center]] | ||
Latest revision as of 14:51, 30 November 2017
 Group 4 Project - A Tale of Bitcoin
|
|
|
|
|
|
|
|
Data source and preparation
The following are the data sets used
- Per minute bitcoin price data, extracted from Kaggle: https://www.kaggle.com/mczielinski/bitcoin-historical-data
- Nasdaq index: https://finance.yahoo.com/quote/%5EIXIC/history?ltr=1
- S&P500: https://finance.yahoo.com/quote/%5EGSPC/history?p=%5EGSPC
- Gold Price: https://finance.yahoo.com/quote/%5EXAU/history?p=%5EXAU
Data was easily downloaded from the link above. The bitcoin data downloaded requires data type conversion from UNIX time stamp to the more common YYYY-MM-DD format. The function [as.POSIXct] in base R easily convert the timestamp into the right format. We have also selected to use data from 2012 onwards because there is only 1-month worth of data in 2011. Excluding this data will not substantially affect our analysis. Data date range is from 1st January 2012 to 20th October 2017 The following are screenshots of the original data imported


