Difference between revisions of "ISSS608 2017-18 T1 Assign WANG YUCHEN Origin and Epidemic Spread"
(Created page with "<div style=background:#2B3856 border:#A3BFB1> 280px <font size = 5; color="#FFFFFF">Smartpolis Epidemic Outbreak </font> <font size = 5; color="#FFFFFF...") |
|||
| (5 intermediate revisions by the same user not shown) | |||
| Line 28: | Line 28: | ||
<font size="5">'''To be a Visual Detective'''</font> | <font size="5">'''To be a Visual Detective'''</font> | ||
| − | = | + | =Origin and Epidemic Spread= |
| + | |||
| + | Identify approximately where the outbreak started on the map (ground zero location). Outline the affected area. Explain how you arrived at your conclusion. (Please limit your answer to six images and 500 words.) | ||
| + | |||
===When and Where the infections start=== | ===When and Where the infections start=== | ||
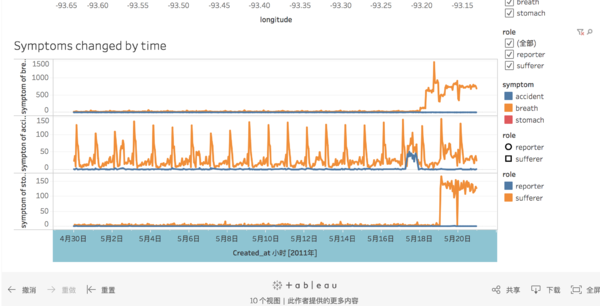
| + | Through the dashboard,we can find those tweets about symptoms of illnesses appeared since 2011/5/18. To be more detailed, the breathing-related illness happened since May 18th 2 am, and the stomach-related illness came a day after at May 19th. | ||
| + | [[File:Time series.png|600px|frameless|center]] | ||
| + | <br /> | ||
| + | |||
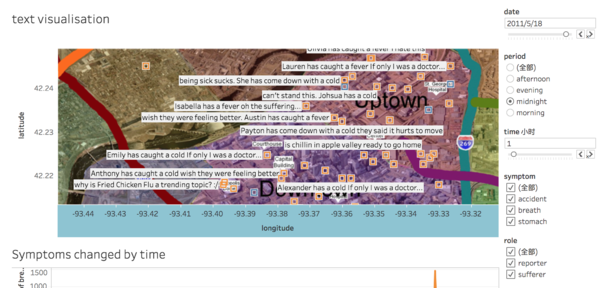
| + | Based on the clue of time, we visualize the trail of the messages for the flu, the relevant tweets firstly appears at the downtown area near 610 bridge at midnight. | ||
| + | [[File:start of flu.png|600px|frameless|center]] | ||
| + | <br /> | ||
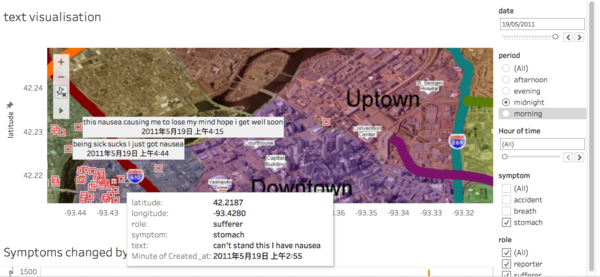
| + | We also explore the source of the stomach issue, though the affected area seems quite different, for the starting point, it also starts near 610 bridge | ||
| + | [[File:start of stomach.png|600px|frameless|center]] | ||
| + | <br /> | ||
| + | |||
| + | In this case, we assume the two type of symptoms are caused by the same accident near the 610 bridge, though the stomach problems came a day later. | ||
| + | |||
| + | ===Which areas are affected=== | ||
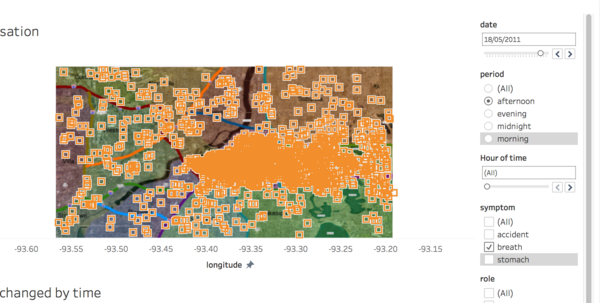
| + | To track which areas are affected,we trace the movement of news and it turns out the two type diseases' s affected areas are quite different. | ||
| + | For the breathing problems, the areas being affected more intensively are the downtown and uptown area, when we look at the tweets distribution in the daytime, it is more centralized in these two parts which are also high population areas. The East part of the city also has more tweets published. | ||
| + | |||
| + | |||
| + | [[File:wroktime breath.png|600px|frameless|center]] | ||
| + | <br /> | ||
| + | While at night, commuters will go home from work which makes the distribution dispersed, but still has higher density in the central part and East past. While considering the factor of climate,the wind direction during the outbreak of breathing issues is also from West to East, which may explain the distribution of the affected areas. | ||
| + | |||
| + | [[File:nightime breath.png|600px|frameless|center]] | ||
| + | <br /> | ||
| + | As for stomach issues, the affected areas seemed to be the same in the two days, mainly in westside, plainville and smog town, which are along the VAST River . | ||
| + | [[File:Stomach affect.png|600px|frameless|center]] | ||
| + | <br /> | ||
Latest revision as of 00:35, 18 October 2017
|
|
|
|
|
To be a Visual Detective
Origin and Epidemic Spread
Identify approximately where the outbreak started on the map (ground zero location). Outline the affected area. Explain how you arrived at your conclusion. (Please limit your answer to six images and 500 words.)
When and Where the infections start
Through the dashboard,we can find those tweets about symptoms of illnesses appeared since 2011/5/18. To be more detailed, the breathing-related illness happened since May 18th 2 am, and the stomach-related illness came a day after at May 19th.
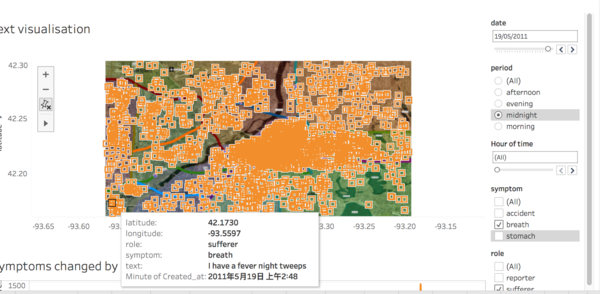
Based on the clue of time, we visualize the trail of the messages for the flu, the relevant tweets firstly appears at the downtown area near 610 bridge at midnight.
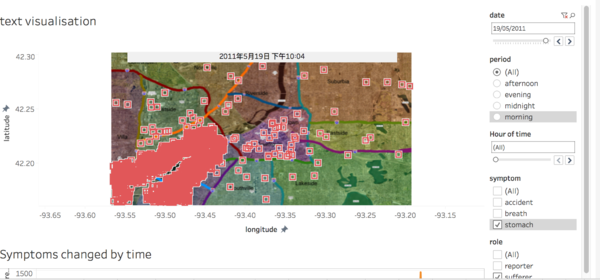
We also explore the source of the stomach issue, though the affected area seems quite different, for the starting point, it also starts near 610 bridge
In this case, we assume the two type of symptoms are caused by the same accident near the 610 bridge, though the stomach problems came a day later.
Which areas are affected
To track which areas are affected,we trace the movement of news and it turns out the two type diseases' s affected areas are quite different. For the breathing problems, the areas being affected more intensively are the downtown and uptown area, when we look at the tweets distribution in the daytime, it is more centralized in these two parts which are also high population areas. The East part of the city also has more tweets published.
While at night, commuters will go home from work which makes the distribution dispersed, but still has higher density in the central part and East past. While considering the factor of climate,the wind direction during the outbreak of breathing issues is also from West to East, which may explain the distribution of the affected areas.
As for stomach issues, the affected areas seemed to be the same in the two days, mainly in westside, plainville and smog town, which are along the VAST River .

