Difference between revisions of "ISSS608 2017-18 T1 Assign ZHANG Lidan Data Preparation"
Jump to navigation
Jump to search
| (5 intermediate revisions by the same user not shown) | |||
| Line 1: | Line 1: | ||
<div style=background:#2B3820 border:#A3BFB1> | <div style=background:#2B3820 border:#A3BFB1> | ||
[[Image:title_momo.png|150px]] | [[Image:title_momo.png|150px]] | ||
| − | <font size = 5; color="#FFFFFF"> | + | <font size = 5; color="#FFFFFF">Epidemic Spread in Smartpolis</font> |
</div> | </div> | ||
<!--MAIN HEADER --> | <!--MAIN HEADER --> | ||
| Line 24: | Line 24: | ||
<br/> | <br/> | ||
==Data Preparation== | ==Data Preparation== | ||
| − | + | * Import the microblog data set into the JMP 13<br/> | |
| − | + | * Exclude 48 rows of missing text<br/> | |
| − | + | [[File:Missingdata.PNG|400px]] | |
| − | + | * Separate the location into longitude and latitude through Word function<br/> | |
| − | [[File: | + | [[File:Location.PNG|300px]] |
| − | + | * Because these locations are at the western hemisphere, change the longitude coordinates into negative value by Num function<br/> | |
| − | [[File: | + | [[File:locationr.PNG|100px]] |
| − | + | * In addition, to exclude the irrelevant information, I create the subset dataset which consists of main flulike symptoms, such as '''''chill, flu, fever, sweat, pain, fatigue, ache, cough, breath, nausea, vomit, diarrhea'''''. Here, I use the Text Explorer in JMP to generate these new columns. | |
| + | [[File:wordget.PNG|500px]]<br/><br/> | ||
| + | [[File:Symptoms.PNG|600px]] | ||
Latest revision as of 15:25, 16 October 2017
|
|
|
|
|
Data Preparation
- Import the microblog data set into the JMP 13
- Exclude 48 rows of missing text
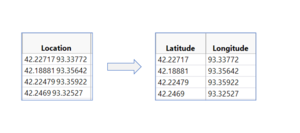
- Separate the location into longitude and latitude through Word function
- Because these locations are at the western hemisphere, change the longitude coordinates into negative value by Num function
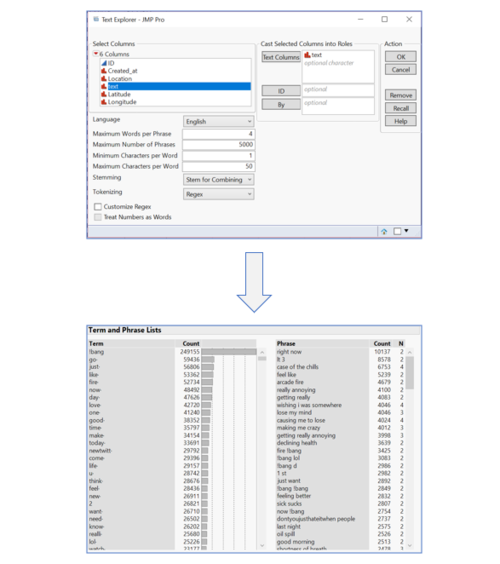
- In addition, to exclude the irrelevant information, I create the subset dataset which consists of main flulike symptoms, such as chill, flu, fever, sweat, pain, fatigue, ache, cough, breath, nausea, vomit, diarrhea. Here, I use the Text Explorer in JMP to generate these new columns.


