Difference between revisions of "Data Preparation"
| (8 intermediate revisions by the same user not shown) | |||
| Line 1: | Line 1: | ||
<div style=background:#FAAC58 border:#A3BFB1> | <div style=background:#FAAC58 border:#A3BFB1> | ||
| − | [[Image:waterbear.jpg| | + | [[Image:waterbear.jpg|150px]] |
<font size = 5; color="#FFFFFF"> ISS608_2017-18_T1_Assign_Yau Hon Tak</font> | <font size = 5; color="#FFFFFF"> ISS608_2017-18_T1_Assign_Yau Hon Tak</font> | ||
</div> | </div> | ||
<!--MAIN HEADER --> | <!--MAIN HEADER --> | ||
{|style="background-color:#FAAC58;" width="100%" cellspacing="0" cellpadding="0" valign="top" border="0" | | {|style="background-color:#FAAC58;" width="100%" cellspacing="0" cellpadding="0" valign="top" border="0" | | ||
| − | | style="font-family:Century Gothic; font-size:100%; solid #000000; background:#FAAC58; text-align:center;" width=" | + | | style="font-family:Century Gothic; font-size:100%; solid #000000; background:#FAAC58; text-align:center;" width="17%" | |
; | ; | ||
| − | [[ | + | [[ISSS608_2017-18_T1_Assign_YAU_HON_TAK| <font color="#FFFFFF">Background</font>]] |
| − | | style="font-family:Century Gothic; font-size:100%; solid #1B338F; background:#FAAC58; text-align:center;" width=" | + | | style="font-family:Century Gothic; font-size:100%; solid #1B338F; background:#FAAC58; text-align:center;" width="17%" | |
; | ; | ||
[[Data Preparation| <font color="#FFFFFF"> Data Preparation </font>]] | [[Data Preparation| <font color="#FFFFFF"> Data Preparation </font>]] | ||
| − | | style="font-family:Century Gothic; font-size:100%; solid #1B338F; background:#FAAC58; text-align:center;" width=" | + | | style="font-family:Century Gothic; font-size:100%; solid #1B338F; background:#FAAC58; text-align:center;" width="17%" | |
; | ; | ||
| − | [[Discovery| <font color="#FFFFFF"> | + | [[Discovery| <font color="#FFFFFF"> Viz </font>]] |
| − | | style="font-family:Century Gothic; font-size:100%; solid #FAAC58; background:#FAAC58; text-align:center;" width=" | + | |
| + | | style="font-family:Century Gothic; font-size:100%; solid #FAAC58; background:#FAAC58; text-align:center;" width="16%" | | ||
| + | ; | ||
| + | [[Ground Zero| <font color="#FFFFFF"> Ground Zero </font>]] | ||
| + | |||
| + | | style="font-family:Century Gothic; font-size:100%; solid #FAAC58; background:#FAAC58; text-align:center;" width="16%" | | ||
; | ; | ||
| − | [[Summary| <font color="#FFFFFF"> | + | [[The Spread| <font color="#FFFFFF"> The Spread </font>]] |
| + | |||
| + | | style="font-family:Century Gothic; font-size:100%; solid #FAAC58; background:#FAAC58; text-align:center;" width="17%" | | ||
| + | ; | ||
| + | [[Summary| <font color="#FFFFFF"> Proposal </font>]] | ||
| | | | ||
| Line 27: | Line 36: | ||
==Data Preparation – Microblogs== | ==Data Preparation – Microblogs== | ||
| − | There is a total of 1m messages. The following image is a summary of by day | + | There is a total of 1m messages. The following image is a summary of by day number of messages. |
| − | [[ | + | |
| + | [[File:MicroblogSummary.PNG|250px]] | ||
To assist with identifying messages relevant to our research, we use JMP pro text explorer to perform the work. The initial text analytics results will parse each message’s individual words. We have changed the default text analytics window to increase “Minimum Characters per Word” to 2, “Maximum Words per Phrase” to 8 and “Stem all terms”. Screenshot as follow | To assist with identifying messages relevant to our research, we use JMP pro text explorer to perform the work. The initial text analytics results will parse each message’s individual words. We have changed the default text analytics window to increase “Minimum Characters per Word” to 2, “Maximum Words per Phrase” to 8 and “Stem all terms”. Screenshot as follow | ||
| − | [[Image:JMPTextFilterSetup. | + | [[Image:JMPTextFilterSetup.PNG|250px]] |
Key words as clues to the symptoms of the sickness has been provided. The key words are: “Observed symptoms are largely flu¬like and include fever, chills, sweats, aches and pains, fatigue, coughing, breathing difficulty, nausea and vomiting, diarrhea, and enlarged lymph nodes.” | Key words as clues to the symptoms of the sickness has been provided. The key words are: “Observed symptoms are largely flu¬like and include fever, chills, sweats, aches and pains, fatigue, coughing, breathing difficulty, nausea and vomiting, diarrhea, and enlarged lymph nodes.” | ||
We have search for these key words and tagged these messages through binary coding onto the main data table. The words and phrases which were used as search are: | We have search for these key words and tagged these messages through binary coding onto the main data table. The words and phrases which were used as search are: | ||
| − | [[Image:SymtomList. | + | [[Image:SymtomList.PNG|250px]] |
A separate data table was created to review the result. Text explorer was ran again, but this time without “Stemming”. Phrases were being reviewed and key words search were being re-performed. Reason for this re-performance was due to stemming process, where unwanted words would have been included. Unusual phrases were being reviewed such as chicken flu are being excluded. | A separate data table was created to review the result. Text explorer was ran again, but this time without “Stemming”. Phrases were being reviewed and key words search were being re-performed. Reason for this re-performance was due to stemming process, where unwanted words would have been included. Unusual phrases were being reviewed such as chicken flu are being excluded. | ||
| Line 48: | Line 58: | ||
Original map | Original map | ||
| − | [[Image:SmartpolisMapOriginal. | + | [[Image:SmartpolisMapOriginal.PNG|500px]] |
| + | |||
Map after grid has been mapped to individual areas. We have color coded the grids here for easier visualisation | Map after grid has been mapped to individual areas. We have color coded the grids here for easier visualisation | ||
| − | [[Image:SmartpolisMapGrid. | + | [[Image:SmartpolisMapGrid.PNG|500px]] |
With the mapped now prepared with grids, the underlying data from data preparation above is further added with Polygon ID, Area, Latitude and Longitude Points of the grids. | With the mapped now prepared with grids, the underlying data from data preparation above is further added with Polygon ID, Area, Latitude and Longitude Points of the grids. | ||
Latest revision as of 10:44, 15 October 2017
|
|
|
|
|
|
|
Data Preparation
Data Preparation – Microblogs
There is a total of 1m messages. The following image is a summary of by day number of messages.
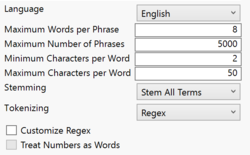
To assist with identifying messages relevant to our research, we use JMP pro text explorer to perform the work. The initial text analytics results will parse each message’s individual words. We have changed the default text analytics window to increase “Minimum Characters per Word” to 2, “Maximum Words per Phrase” to 8 and “Stem all terms”. Screenshot as follow
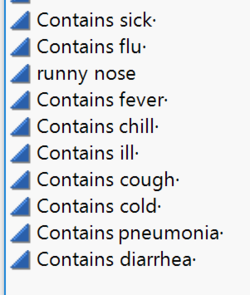
Key words as clues to the symptoms of the sickness has been provided. The key words are: “Observed symptoms are largely flu¬like and include fever, chills, sweats, aches and pains, fatigue, coughing, breathing difficulty, nausea and vomiting, diarrhea, and enlarged lymph nodes.” We have search for these key words and tagged these messages through binary coding onto the main data table. The words and phrases which were used as search are:
A separate data table was created to review the result. Text explorer was ran again, but this time without “Stemming”. Phrases were being reviewed and key words search were being re-performed. Reason for this re-performance was due to stemming process, where unwanted words would have been included. Unusual phrases were being reviewed such as chicken flu are being excluded. Final results came down to 52k.
Data Preparation – Smartpolis map
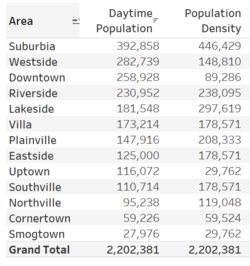
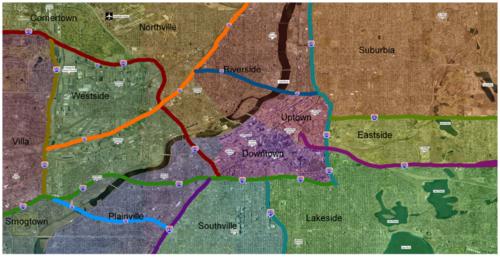
The map latitude (height) length is 13.9km and the longitude (width) length is 27.4km. This map can be split up into 0.99km (height) x 1.01km (width) grid, which makes each grid into 1km^2. There is a total of 378 grids. Each of these grid is then mapped into the 13 Areas of Smartpolis. The grids is prepared by building manual polygons. The results will be as follow:
Original map
Map after grid has been mapped to individual areas. We have color coded the grids here for easier visualisation
With the mapped now prepared with grids, the underlying data from data preparation above is further added with Polygon ID, Area, Latitude and Longitude Points of the grids.


