Difference between revisions of "ISSS608 2017-18 T1 Assign FOO CELONG RAYMOND/MakingSenseOfTheChatter"
Jump to navigation
Jump to search

m (Raymondfoo.2016 moved page ISS608 2017-18 T1 Assign Foo Celong Raymond/MakingSenseOfTheChatter to ISSS608 2017-18 T1 Assign FOO CELONG RAYMOND/MakingSenseOfTheChatter) |
|||
| Line 2: | Line 2: | ||
__NOTOC__ | __NOTOC__ | ||
| − | <div style="position:relative; top:-50px; margin:auto; width:900px; background-color:# | + | <div style="position:relative; top:-50px; margin:auto; width:900px; background-color:#e6ecf0; border: thin solid #A6A6A6;"> |
<div style="width:900px; background-color:#2F3A70; height: 20px"></div> | <div style="width:900px; background-color:#2F3A70; height: 20px"></div> | ||
<br \> | <br \> | ||
| + | |||
| + | <div style="color:#0F1940; padding-left: 10px; font-size: 3vh; font-family: 'Helvetica Neue', Helvetica, Arial, sans-serif;">Exploring and Organising the Data</div> | ||
| + | <div style="padding-left: 10px; color:#0F1940; font-size: 16px; font-weight: bold; font-family: 'Courier New', Courier, monospace"> | ||
| + | |||
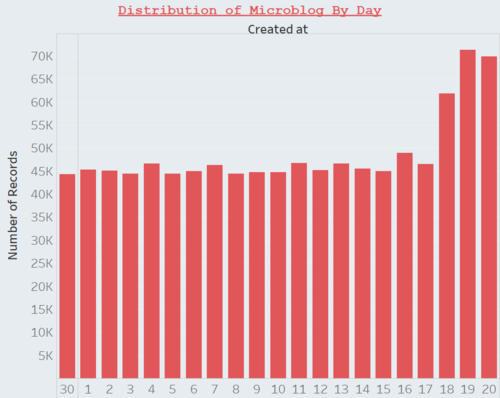
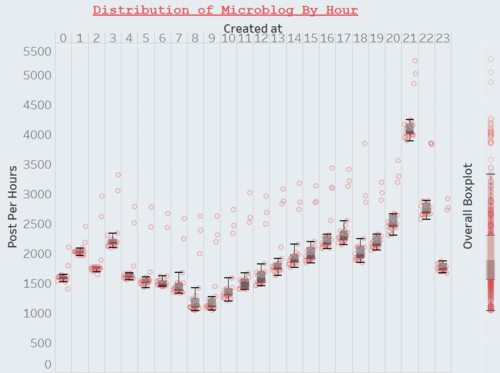
| + | <p>First thing first, the number of microblog is massive. I looked through to see the distribution of posts over time.</p> | ||
| + | [[File:RaymMicroblogPerDay.png|500px|center]] | ||
<br \> | <br \> | ||
| + | [[File:RaymMicroblogPerHour.png|500px|center]] | ||
| + | |||
| + | <p>The data will need to be organised in some manner so that they can be easily analysed later. The obvious choice is by city zones.</p> | ||
| + | |||
| + | </div> | ||
</div> | </div> | ||
Revision as of 20:27, 13 October 2017

Exploring and Organising the Data
First thing first, the number of microblog is massive. I looked through to see the distribution of posts over time.


The data will need to be organised in some manner so that they can be easily analysed later. The obvious choice is by city zones.