Difference between revisions of "RShinyApp"
Jump to navigation
Jump to search
(Created page with "<div style=background:#565656 border:#565656> 400px <font size = 6;text-align:center; color="#FFFFFF"> Group 6 - Will Beijing Air Quality Be Better? </fon...") |
|||
| (One intermediate revision by the same user not shown) | |||
| Line 1: | Line 1: | ||
<div style=background:#565656 border:#565656> | <div style=background:#565656 border:#565656> | ||
| − | [[Image: | + | [[Image:air3.jpg|400px]] |
| − | <font size = 6;text-align:center; color="#FFFFFF"> Group 6 - | + | <font size = 6;text-align:center; color="#FFFFFF"> Group 6 - How is Beijing Air Quality? </font> |
</div> | </div> | ||
<!--MAIN HEADER --> | <!--MAIN HEADER --> | ||
| Line 20: | Line 20: | ||
| style="font-family:Century Gothic; font-size:100%; solid #1B338F; background:#565656; text-align:center;" width="25%" | | | style="font-family:Century Gothic; font-size:100%; solid #1B338F; background:#565656; text-align:center;" width="25%" | | ||
; | ; | ||
| − | [[ISSS608_2017- | + | [[ISSS608_2017-18_T1_Group6_Report| <font color="#FFFFFF">Report</font>]] |
| | | | ||
| Line 26: | Line 26: | ||
== APP INTRODUCTION == | == APP INTRODUCTION == | ||
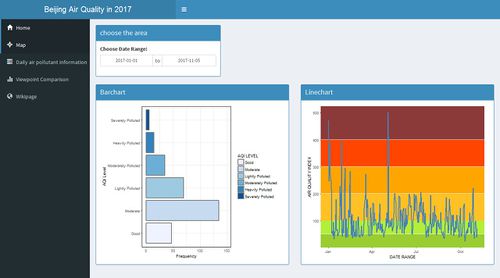
| + | <br />Page 1:Homepage - Barchart & Linechart<br/> | ||
| + | [[File:Page1.jpg|500px]]<br/> | ||
| + | <br /><br/> | ||
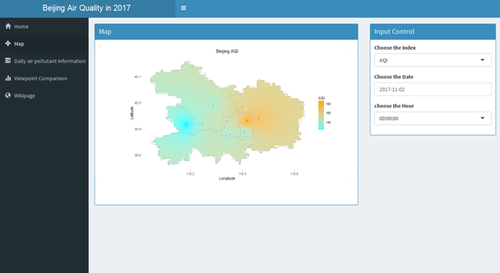
| + | <br />Page 2:Map - Raster Map<br/> | ||
| + | [[File:Page2.png|500px]]<br/> | ||
| + | <br /><br/> | ||
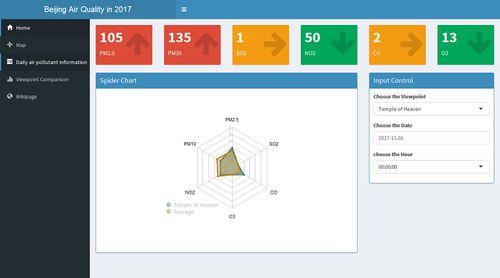
| + | <br />Page 3:Daily air pollutant information - Spider Chart<br/> | ||
| + | [[File:Page3.jpg|500px]]<br/> | ||
| + | <br /><br/> | ||
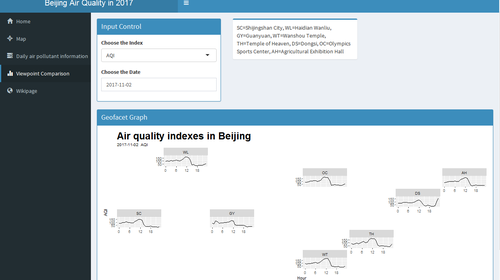
| + | <br />Page 4:Viewpoint Comparison - Geofecet Graph<br/> | ||
| + | [[File:Page4.png|500px]]<br/> | ||
| + | |||
== APP LINK == | == APP LINK == | ||


