Difference between revisions of "ISSS608 2017-18 T1 Assign WANG RUI Insights"
Ruiwang.2016 (talk | contribs) |
Ruiwang.2016 (talk | contribs) |
||
| (One intermediate revision by the same user not shown) | |||
| Line 38: | Line 38: | ||
<br/> | <br/> | ||
On May 20, inhalation disease was still out of control and it was spreading. All hospitals were crowed by patients with flu-like symptoms. | On May 20, inhalation disease was still out of control and it was spreading. All hospitals were crowed by patients with flu-like symptoms. | ||
| − | <br/><br/>[https://public.tableau.com/profile/rui6929#!/vizhome/assign1_15/Story1?publish=yes'''Check this Tableau Dashboard'''] | + | <br/><br/> |
| + | [https://public.tableau.com/profile/rui6929#!/vizhome/assign1_15/Story1?publish=yes'''Check this Tableau Dashboard'''] | ||
<br/> | <br/> | ||
| Line 123: | Line 124: | ||
<tr> | <tr> | ||
<td><b> 3. Waterborne Transmission </b> | <td><b> 3. Waterborne Transmission </b> | ||
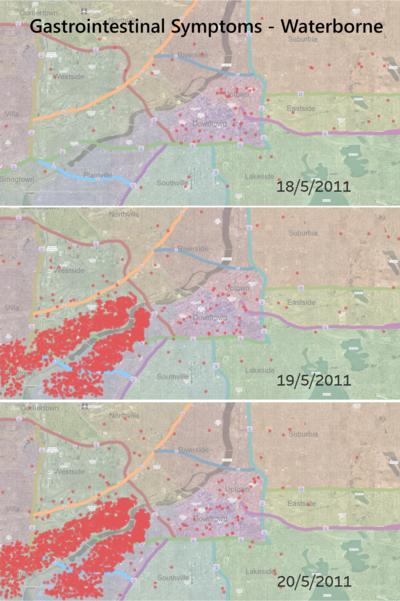
| − | It can easily be seen that on May 18th there were few cases on gastrointestinal epidemic. Whereas on May 19th south-western part of the city along the river is affected. The reported number of cases didn't increase much on May 20th and location is aggregated in the south-western part. There is not sign of spreading. The river underneath flowed South at 3 mile/hour. And the distance from ground 0 is around 7 miles. It took less than 3 hours for epidemic to transmit to the end of city. | + | It can easily be seen that on May 18th there were few cases on gastrointestinal epidemic. Whereas on May 19th south-western part of the city along the river is affected. The reported number of cases didn't increase much on May 20th and location is aggregated in the south-western part. There is not sign of spreading. The river underneath flowed South at 3 mile/hour. And the distance from ground 0 is around 7 miles. It took less than 3 hours for epidemic to transmit to the end of city. <br/>From 19 May to 20 May, number of gastrointestinal symptoms didn't change much and they tend to stay in the same location which might be their homes. There wasn't spreading pattern for this disease which might because it is not infectious disease. Only people who drink the polluted water will be infected. |
</td> | </td> | ||
| Line 130: | Line 131: | ||
<tr> | <tr> | ||
<td><b> 4. Airborne Transmission </b> | <td><b> 4. Airborne Transmission </b> | ||
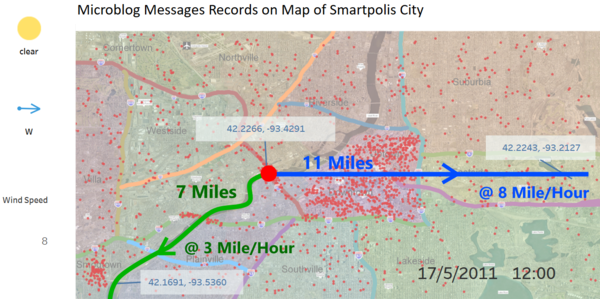
| − | It can easily be seen that from 0am to 6am on May 18th there were few cases on inhalation epidemic. Whereas starting from 7am, increasing number of cases were reported in downtown and uptown area. After 6pm when people went home from office, the symptoms spread out.There is a | + | It can easily be seen that from 0am to 6am on May 18th there were few cases on inhalation epidemic. Whereas starting from 7am, increasing number of cases were reported in downtown and uptown area. After 6pm when people went home from office, the symptoms spread out in the entire city.There is a risk of spreading. At that time, the sky is clear with West wind speed at 8 miles/hour. Since the distance from ground 0 to the westernmost is around 11 miles. It took less than 3 hours for epidemic to transmit to the end of city. |
</td> | </td> | ||
<td>[[File:wrair.png|400px|center]]</td> | <td>[[File:wrair.png|400px|center]]</td> | ||
| Line 136: | Line 137: | ||
<tr> | <tr> | ||
<td><b> 5. Person-to-Person Transmission </b> | <td><b> 5. Person-to-Person Transmission </b> | ||
| − | On May | + | As discussed in the waterborne transmission part, gastrointestinal symptoms seem to be non-infectious and under control. Total amount of infectors were contained. |
| + | However for inhalation related illness which outbroke in the working zones. There had been an increasing number of records. During the working hours of 8am to 6pm, 5891 ID cases on inhalation are posted. All of which are posted in the airborne transmission affecting locations. On May 19, the situations become worse. 47% more inhalation cases were reported. On May 20, inhalation disease was still out of control and it was spreading. Additionally a lot of smaller dense clusters show up. These correspond to the locations of hospitals. All hospitals were crowed by patients with flu-like symptoms. | ||
</td> | </td> | ||
<td>[[File:wrperson.png|400px|center]]</td> | <td>[[File:wrperson.png|400px|center]]</td> | ||
| Line 148: | Line 150: | ||
<b>Question:</b>Is the outbreak contained? Is it necessary for emergency management personnel to deploy treatment resources outside the affected area? Explain your reasoning. (Please limit your answer to ten images and 1000 words. ) | <b>Question:</b>Is the outbreak contained? Is it necessary for emergency management personnel to deploy treatment resources outside the affected area? Explain your reasoning. (Please limit your answer to ten images and 1000 words. ) | ||
<br/> | <br/> | ||
| − | <b>Answer:</b> The outbreak is not contained and it is getting worse. Emergency management actions are necessary to control the epidemic from spreading out. | + | <b>Answer:</b> The outbreak of inhalation related symptoms is not contained and it is getting worse. Emergency management actions are necessary to control the epidemic from spreading out. |
<table border='1'> | <table border='1'> | ||
<tr> | <tr> | ||
| Line 156: | Line 158: | ||
<tr> | <tr> | ||
<td><b> 1. Descriptive Epidemiology Study - Inhalation Epidemic </b> | <td><b> 1. Descriptive Epidemiology Study - Inhalation Epidemic </b> | ||
| − | + | Different characteristic symptoms occur at different point of time. | |
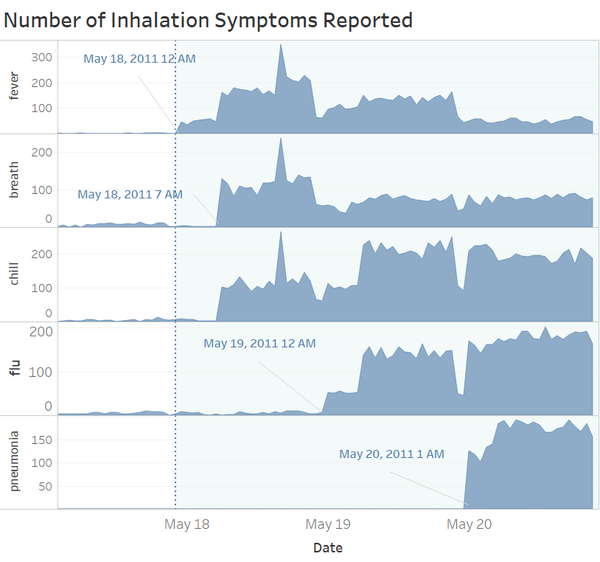
| − | symptoms. For the downtown area, the main symptoms developed | + | For the downtown and uptown area, the main symptoms developed from fever, chill and shortness of breath on May 18th. And on May 19th, there was an increase in cough and flu. Finally, on May 20th pneumonia cases were largely reported. It clearly shows that the symptoms were changing when state of illness developed and became worse. And number of cases kept increasing for the last 3 days. Actions should be taken to control people with inhalation symptoms out of crowded area. |
| − | from fever and shortness of breath on May 18th | + | |
| − | |||
| − | reported | ||
| − | of the | ||
| − | |||
| − | |||
| − | |||
</td> | </td> | ||
<td>[[File:wrtime1.png|600px|center]]</td> | <td>[[File:wrtime1.png|600px|center]]</td> | ||
| Line 170: | Line 166: | ||
<tr> | <tr> | ||
<td><b> 2. Descriptive Epidemiology Study - Gastrointestinal Epidemic </b> | <td><b> 2. Descriptive Epidemiology Study - Gastrointestinal Epidemic </b> | ||
| − | + | Interestingly, the symptoms in the south western part of the town are different. | |
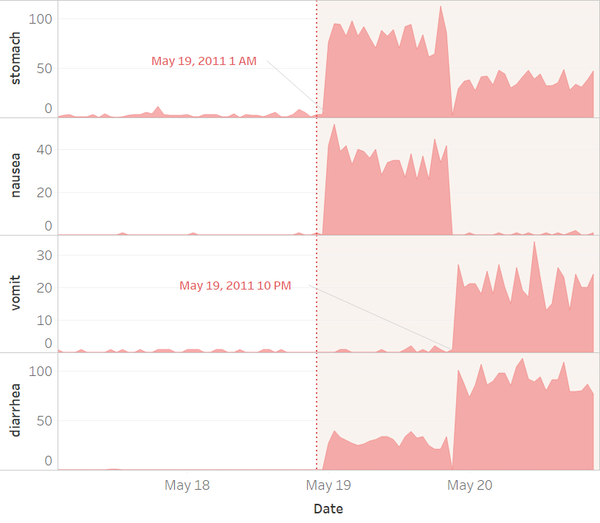
| − | + | On May 19th, stomachache and nausea were the two common symptoms observed. And on May 20th, diarrhea and vomit are the dominating symptom that people report about. It clearly shows that the symptoms were changing when state of illness developed and became worse. | |
| − | |||
| − | |||
| − | |||
| − | of the town are different. On | ||
| − | diarrhea | ||
| − | |||
| − | |||
</td> | </td> | ||
<td>[[File:wrtime2.png|600px|center]]</td> | <td>[[File:wrtime2.png|600px|center]]</td> | ||
Latest revision as of 01:03, 18 October 2017
|
|
|
|
|
|
On May 17 during lunch hour, a truck got an accident on bridge 610 over the river. The spot was very close to downtown area, where many people worked at and therefore there are many witnesses. Around 500 microblogs related to this accident were reported. More than 20 Witnesses claimed that the severe accident smashed the truck and caused it to spill its cargo. But there was not much information on what the truck carried and what the leakage look like.
At that time, the sky is clear with West wind at 8 mile/hour. The river underneath flowed South at 3 mile/hour.
12 hours after the accident which is mid-night of May 18, there were less than 50 cases of fever reported. 7 hours later at 7 am in the morning, there was a outbreak of flu-like symptoms including fever, chill and breath shortage in working zones where people started to work. During the working hours of 8am to 6pm, 5891 ID cases on inhalation are posted. All of which are posted in the airborne transmission affecting locations.
On May 19, the situations become worse. 47% more inhalation cases were reported. Even worse, there was a outbreak of gastrointestinal symptoms along the vast river. The infected persons had symptoms like stomachache, vomit, diarrhea and nausea. These patients mostly stay at home from May 19 to May 20 and total number of gastrointestinal related patients didn't increase significantly.
On May 20, inhalation disease was still out of control and it was spreading. All hospitals were crowed by patients with flu-like symptoms.
Check this Tableau Dashboard
Origin
Question: Identify approximately where the outbreak started on the map (ground zero location). Outline the affected area. Explain how you arrived at your conclusion.
Answer: The outbreak location is near the 610 bridge. There are two parts of affected area. One part is on south of 610 bridge along the Vast river. The other part is on west of 610 bridge spread by the west wind.
| Explanation | Visualization |
|---|---|
| 1. Make Hypothesis on Symptoms
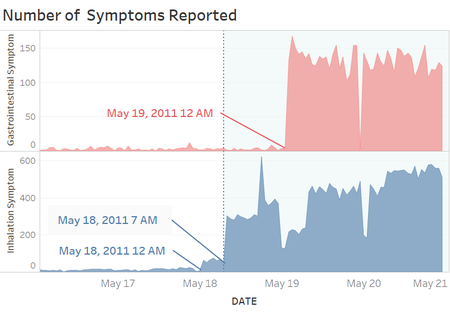
Epi curve is used to visualize the onset of illness among cases associated with an outbreak. The outbreak's time pattern is implied by distribution of cases over time. According to the figures on the right, two epi curves are plotted separately for inhalation and gastrointestinal illness.
Inhalation symptom outbroke at 7am on May 18 and maintain an increasing trend. Whereas gastrointestinal symptom outbroke one day later at 12 am on May 19, after which number of reported cases didn’t increase much. It is reasonable to assume that inhalation and gastrointestinal epidemic are having different patterns. Now let's zoom into hourly records at the outbreak points of time. |
|
| 2. Outbreak Time Inspection - Inhalation Epidemic
According to the epi curve, the outbreak occurred at 7am on 18 May. As a comparison, both 7am and 8am message records which mentioned inhalation symptoms are plotted on the map. From 6am to 7am, there were only 2 relevant records observed. Then within one hour, 1,674 cases of inhalation disease outbroke. The affected locations are mostly to the west of downtown which are highlighted using a triangle shape envelop. |
|
| 3. Outbreak Time Inspection - Gastrointestinal Epidemic
According to the epi curve, the outbreak occurred around 1am on 19 May. As a comparison, both 1am and 2am message records which mentioned gastrointestinal symptoms are plotted on the map. From 12am to 1am, there were only 1 relevant records observed. Then within one hour, 1,260 cases of gastrointestinal disease outbroke. The affected locations are mostly in the west south part of Smartpolis along the Vast river which are highlighted using a trapezoid envelop. |
|
| 4. Tracing Ground 0
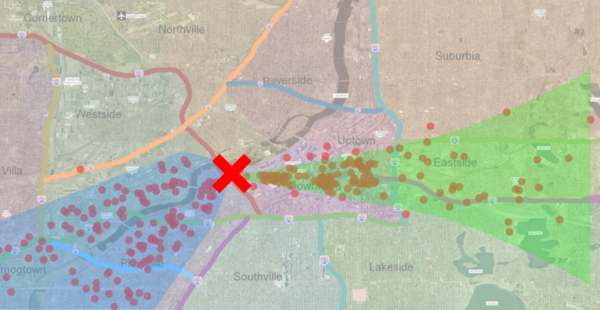
To find the outbreak location for both symptoms, I overlay the observations onto one map and show the envelop. An intersection point can be easily identified which is near the Vast river facing downtown. This location is taken as the ground zero of epidemic. |
|
| 5. Conclusion and Validate the Hypothesis
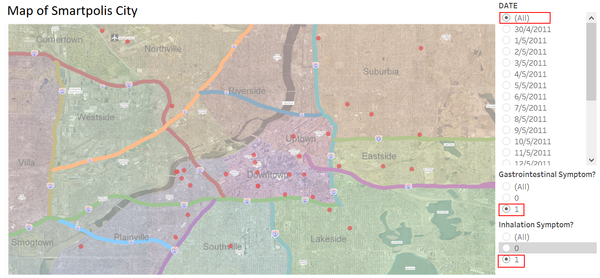
Now, let's validate the hypothesis on two types of symptoms. The picture on the right shows people who have both symptoms and there are less than 30 records. As a summary, it is clearly observed that inhalation and gastrointestinal illness outbreak at different time and locations on different people. Therefore, the hypothesis is valid. |
Transmission
Question: Present a hypothesis on how the infection is being transmitted. For example, is the method of transmission person-to-person, airborne, waterborne, or something else? Identify the trends that support your hypothesis.
Answer: The infection is transmitted from different channels. It is a mix of airborne, waterborne and person-to-person transmissions.
| Explanation | Visualization |
|---|---|
| 1. Identify Special Event near Ground Zero Location
With ground 0 location identified, next I will study events of interest that happened before the outbreak time and potentially led to the outbreak.
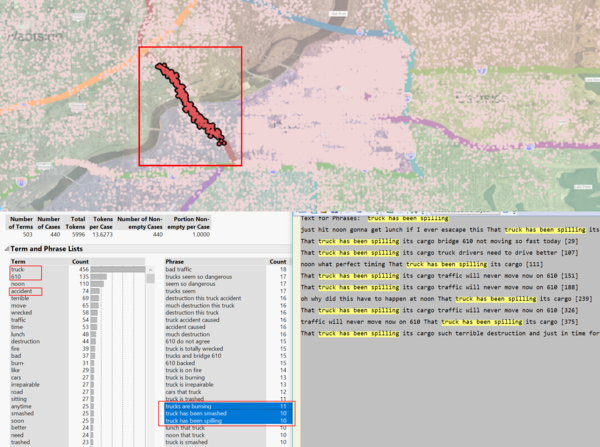
The technique used here is to study location with high variance of message count. Significant increase in number of microblog may imply a special event.
|
|
| 2. Hypothesize on Transmission Methods
According to the messages, the truck was leaking on the bridge. However there was not much information on what the truck carried and what the leakage look like. Assuming the cargo leaked is volatile and soluble in water. It is reasonable to hypothesize that the cargo was the cause of the disease and the spread happened both waterborne along the river and airborne in wind direction to downtown. |
|
| 3. Waterborne Transmission
It can easily be seen that on May 18th there were few cases on gastrointestinal epidemic. Whereas on May 19th south-western part of the city along the river is affected. The reported number of cases didn't increase much on May 20th and location is aggregated in the south-western part. There is not sign of spreading. The river underneath flowed South at 3 mile/hour. And the distance from ground 0 is around 7 miles. It took less than 3 hours for epidemic to transmit to the end of city. |
|
| 4. Airborne Transmission
It can easily be seen that from 0am to 6am on May 18th there were few cases on inhalation epidemic. Whereas starting from 7am, increasing number of cases were reported in downtown and uptown area. After 6pm when people went home from office, the symptoms spread out in the entire city.There is a risk of spreading. At that time, the sky is clear with West wind speed at 8 miles/hour. Since the distance from ground 0 to the westernmost is around 11 miles. It took less than 3 hours for epidemic to transmit to the end of city. |
|
| 5. Person-to-Person Transmission
As discussed in the waterborne transmission part, gastrointestinal symptoms seem to be non-infectious and under control. Total amount of infectors were contained. However for inhalation related illness which outbroke in the working zones. There had been an increasing number of records. During the working hours of 8am to 6pm, 5891 ID cases on inhalation are posted. All of which are posted in the airborne transmission affecting locations. On May 19, the situations become worse. 47% more inhalation cases were reported. On May 20, inhalation disease was still out of control and it was spreading. Additionally a lot of smaller dense clusters show up. These correspond to the locations of hospitals. All hospitals were crowed by patients with flu-like symptoms. |
Containment
Question:Is the outbreak contained? Is it necessary for emergency management personnel to deploy treatment resources outside the affected area? Explain your reasoning. (Please limit your answer to ten images and 1000 words. )
Answer: The outbreak of inhalation related symptoms is not contained and it is getting worse. Emergency management actions are necessary to control the epidemic from spreading out.
| Explanation | Visualization |
|---|---|
| 1. Descriptive Epidemiology Study - Inhalation Epidemic
Different characteristic symptoms occur at different point of time. For the downtown and uptown area, the main symptoms developed from fever, chill and shortness of breath on May 18th. And on May 19th, there was an increase in cough and flu. Finally, on May 20th pneumonia cases were largely reported. It clearly shows that the symptoms were changing when state of illness developed and became worse. And number of cases kept increasing for the last 3 days. Actions should be taken to control people with inhalation symptoms out of crowded area. |
|
| 2. Descriptive Epidemiology Study - Gastrointestinal Epidemic
Interestingly, the symptoms in the south western part of the town are different. On May 19th, stomachache and nausea were the two common symptoms observed. And on May 20th, diarrhea and vomit are the dominating symptom that people report about. It clearly shows that the symptoms were changing when state of illness developed and became worse. |

