Difference between revisions of "Insights"
| (One intermediate revision by the same user not shown) | |||
| Line 1: | Line 1: | ||
| + | <div style=background:#AD5A5A border:#A3BFB1> | ||
| + | [[File:1.jpg|frameless]] | ||
| + | <font size = 5; color="#FFFFFF">ISSS608 Visual Analytics and Applications Assign ZHOU CHEN</font> | ||
| + | </div> | ||
<!--MAIN HEADER --> | <!--MAIN HEADER --> | ||
| − | {|style="background-color:# | + | {|style="background-color:#AD5A5A;" width="100%" cellspacing="0" cellpadding="0" valign="top" border="0" | |
| − | | style="font-family:Century Gothic; font-size:100%; solid #000000; background:# | + | | style="font-family:Century Gothic; font-size:100%; solid #000000; background:#AD5A5A; text-align:center;" width="25%" | |
; | ; | ||
[[ISSS608_2017-18_T1_Assign_ZHOU CHEN| <font color="#FFFFFF">Introduction</font>]] | [[ISSS608_2017-18_T1_Assign_ZHOU CHEN| <font color="#FFFFFF">Introduction</font>]] | ||
| − | | style="font-family:Century Gothic; font-size:100%; solid #1B338F; background:# | + | | style="font-family:Century Gothic; font-size:100%; solid #1B338F; background:#AD5A5A; text-align:center;" width="25%" | |
; | ; | ||
[[Data Preparation Process| <font color="#FFFFFF">Data Preparation Process</font>]] | [[Data Preparation Process| <font color="#FFFFFF">Data Preparation Process</font>]] | ||
| Line 13: | Line 17: | ||
[[Insights| <font color="#FFFFFF">Insights</font>]] | [[Insights| <font color="#FFFFFF">Insights</font>]] | ||
| − | | style="font-family:Century Gothic; font-size:100%; solid #1B338F; background:# | + | | style="font-family:Century Gothic; font-size:100%; solid #1B338F; background:#AD5A5A; text-align:center;" width="25%" | |
; | ; | ||
[[Conclusion| <font color="#FFFFFF">Conclusion</font>]] | [[Conclusion| <font color="#FFFFFF">Conclusion</font>]] | ||
| Line 20: | Line 24: | ||
|} | |} | ||
<br/> | <br/> | ||
| + | |||
=Origin and Epidemic Spread= | =Origin and Epidemic Spread= | ||
===Question=== | ===Question=== | ||
| Line 44: | Line 49: | ||
<center>Figure 1-6</center> | <center>Figure 1-6</center> | ||
In order to find the specific origin area in downtown, extract the location of all the flulike people who sent the microblog related to symptoms during May 18th 8AM to 9AM. Applying clustering analysis into these locations, it can provide some information related to origin area. Refer to Figure 1-7, there are five clusters and most of points are located in two main clusters, which are close to Vastopolis Dome and Vastopolis City Hospital in the map. | In order to find the specific origin area in downtown, extract the location of all the flulike people who sent the microblog related to symptoms during May 18th 8AM to 9AM. Applying clustering analysis into these locations, it can provide some information related to origin area. Refer to Figure 1-7, there are five clusters and most of points are located in two main clusters, which are close to Vastopolis Dome and Vastopolis City Hospital in the map. | ||
| − | [[File:1-7.jpg| | + | [[File:1-7.jpg|600px|frameless|center]] <br /> |
<center>Figure 1-7</center> | <center>Figure 1-7</center> | ||
Latest revision as of 23:30, 15 October 2017
|
|
|
|
|
Contents
Origin and Epidemic Spread
Question
Identify approximately where the outbreak started on the map (ground zero location). Outline the affected area. Explain how you arrived at your conclusion.
Analysis
Before exploring the outbreak location, it is important to map the microblogs onto the whole map in the data preparation process. After mapping all the flulike people with the time of first message they sent, some visualization can be built for finding the outbreak location.
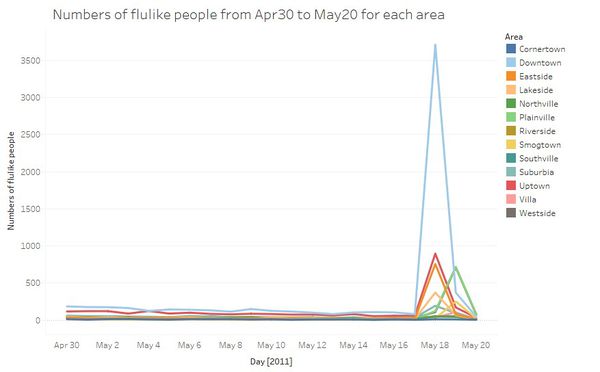
Figure 1-1 shows the numbers of flulike people from Apr30 to May20 group by the area. Before May 18th, the number is stable and not that large. However, in some areas, microblog with symptoms related to flulike increase rapidly on May 18th, especially downtown, uptown and eastside area. On May 19th, the numbers in three areas mentioned before decrease but numbers of flulike people in Northville and Plainville increase rapidly. Hence, we can assume that there are two outbreaks, where the first flulike outbreaks on May 18th in some areas and the flulike outbreaks again on May 19th in other areas. Some other visualization of days from May 17th to May 20th can be built for further information.
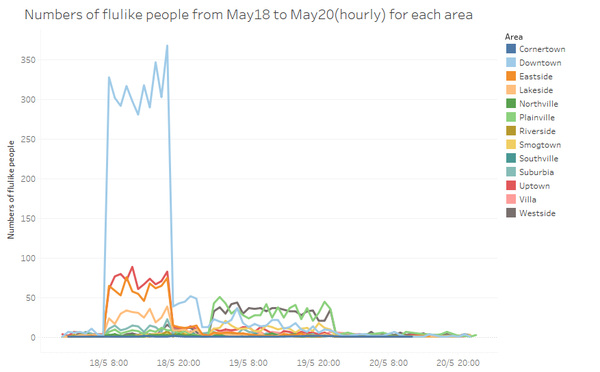
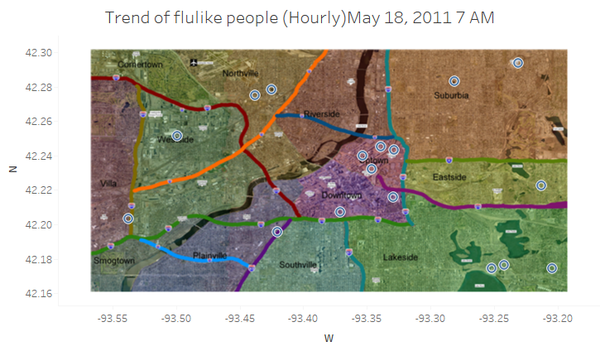
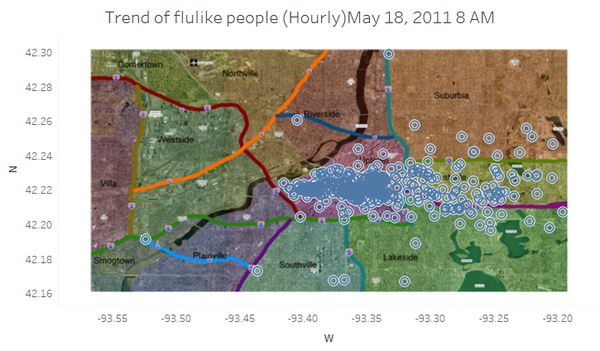
From Figure 1-2, we can get the specific time of two outbreak. The first outbreak happens from May 18th 8am and the second flulike outbreaks on May 19th 2AM. In order to find the origin area of the outbreak, it is better to visual the movement (trend) of flulike people on May 18th specifically (Hourly basis or Minutes basis). The Figure 1-3 and Figure 1-4 represents the location of flulike people who send the first message on May 18th 7 AM and 8 AM separately. Comparing these two figures, we can find the flulike people in downtown and uptown area increase rapidly during this period.
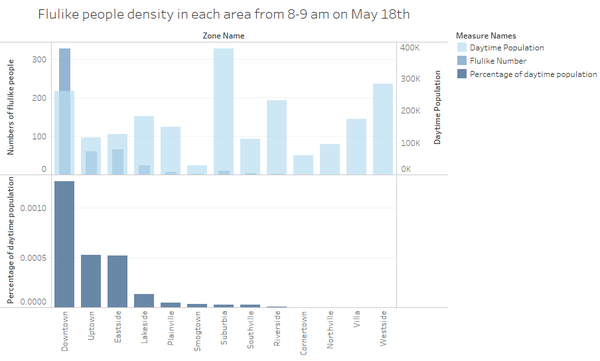
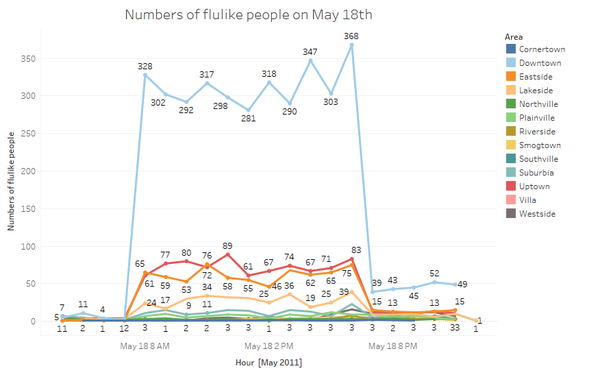
However, it does not represent the downtown and uptown area are the origin of outbreak completely. For further confirmation, it is better to compare with daytime population because the daytime population of each area are quite different and the range varies. Refer to the Figure 1-5, it shows the percentage of flulike people in daytime population for each area. Downtown area is not the area with largest population in the daytime but has largest numbers of flulike people and occupies the largest percentage of those people in daytime population. In addition, Figure 1-6 shows the numbers of flulike people in each area on May 18th whole day. Hence, the first outbreak starts from Downtown and then Uptown area (first largest area affected by first outbreak). Later it spreads to Eastside area, which is second largest area affected by first outbreak.
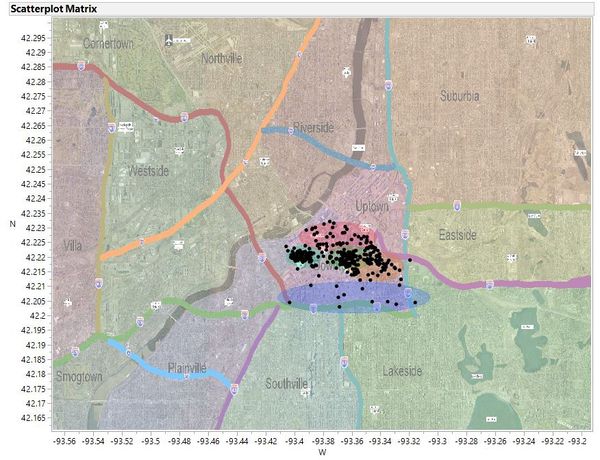
In order to find the specific origin area in downtown, extract the location of all the flulike people who sent the microblog related to symptoms during May 18th 8AM to 9AM. Applying clustering analysis into these locations, it can provide some information related to origin area. Refer to Figure 1-7, there are five clusters and most of points are located in two main clusters, which are close to Vastopolis Dome and Vastopolis City Hospital in the map.
Epidemic Spread
Question
Present a hypothesis on how the infection is being transmitted. For example, is the method of transmission person-to-person, airborne, waterborne, or something else? Identify the trends that support your hypothesis. Is the outbreak contained? Is it necessary for emergency management personnel to deploy treatment resources outside the affected area? Explain your reasoning.
Analysis
Hypothesis:
1. The first outbreak (May 18th 8AM) is spread through person-to-person and airborne method. In addition, the flu is not contained.
2. The second outbreak (May 19th) is transmitted mainly due to waterborne method and it is contained.
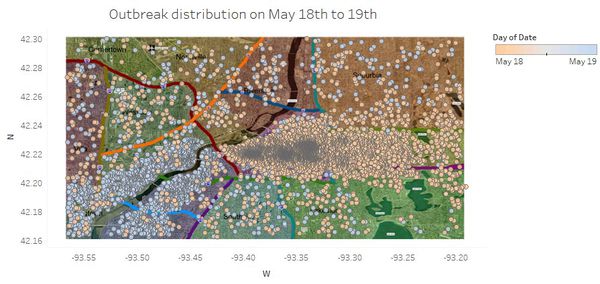
In the part 1, the outbreak time have been identified, which the first outbreak starts from May 18th 8am and the second flulike outbreaks from May 19th 2AM. Visualizing the location of first message sent by flulike people on May 18th and May 19th (Refer to Figure 2-1), there is an interesting finding that the microblog from flulike people on May 18th are concentrated on middle to east area, including downtown, uptown and Eastside area. However, most of microblog messages from people feeling ill are located along the Vast River, including Plainville, Smogtown and Westside area.
What cause the differences of distribution on two days?
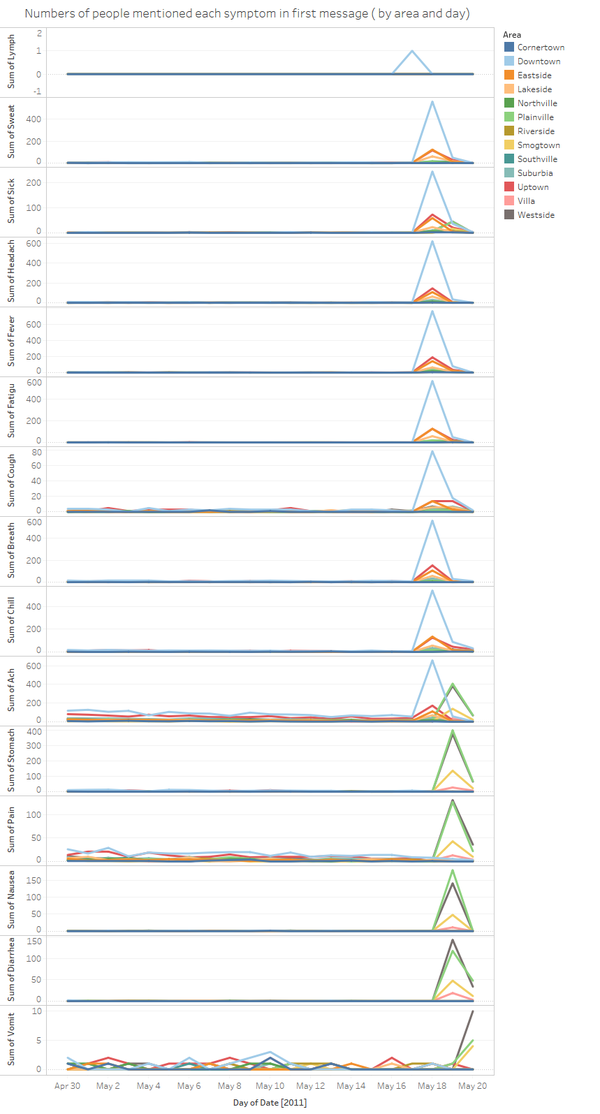
First of all, visualize the symptom keywords extracted in the data preparation process by area and date. Figure 2-2 shows there are five patterns of trend of symptom appeared.
1> The symptom related to lymph appears on May 17th only.
2> The numbers of keywords including sweets, sick, headache, fever, fatigue, cough, breathe and chills increase rapidly on May 18th and then drop on May 19th. These keywords are related to the first outbreak of flu. There are more similarities in this pattern. For example, Downtown area has largest numbers of each symptoms appeared and then go with Eastside and Uptown area.
3> For the graph of symptom ache, it contains the characteristics of second and fourth pattern. There are two outbreaks of this symptom, happened on May 18th and May 19th separately. The scale of first outbreak is more severe than the second outbreak. In addition, the location of symptom ache on these two days are completely different.
4> The symptom stomach, pain, nausea and diarrhoea increase rapidly on May 19th and focus on Plainville and Northville area. These symptoms are relevant to the second outbreak of flu, which are totally different from first outbreak.
5> The graph of symptom vomit shows it mainly focus on May 20th in Northville area. Refer to the five patterns mentioned, we know the symptoms, location and time of two outbreak are quite different. The first outbreak flu is more related to headache, fever and cough but the second outbreak flu is relevant to the gastric problem, which will cause nausea and diarrhoea. These differences may due to the cause and transmission methods of two outbreaks are different.
The first outbreak
1.Person to person
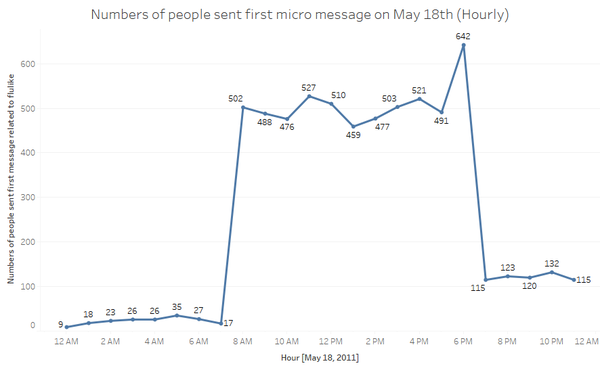
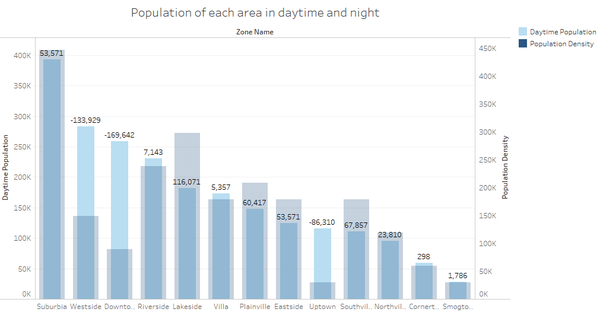
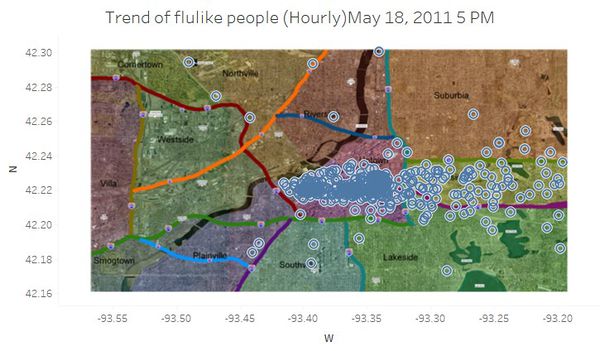
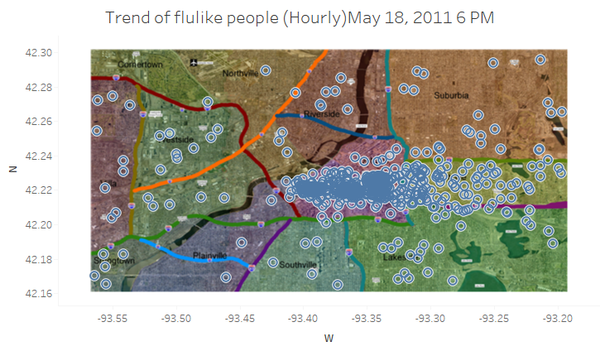
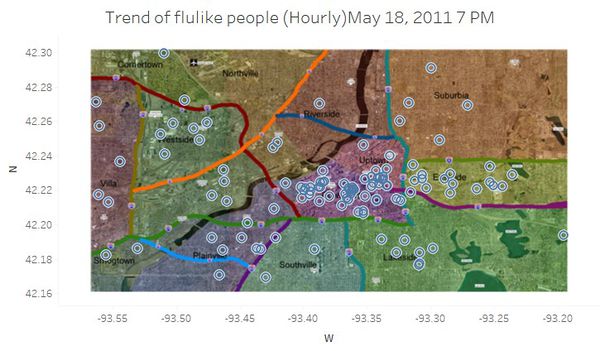
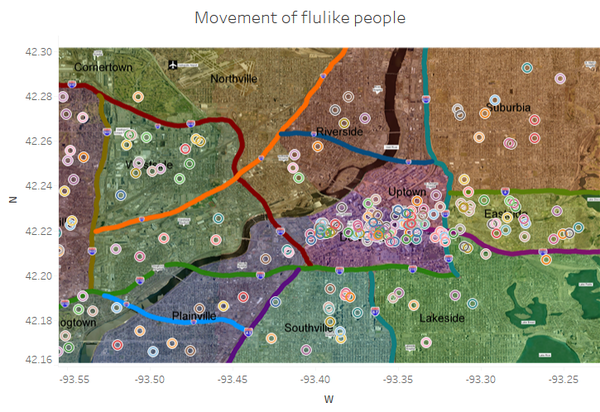
From Figure 2-3, there are two main fluctuation period for numbers of people who sent first micro message on May 18th, 8AM and 6 PM. Mentioned in the previous part, the first outbreak appears on 8AM in Downtown area, which is the third largest area that people concentrate in the daytime (Refer to Figure 2-4). As for the increase on 6PM, most of people will finish their daily work and come back home from office during that period and based on the population density in figure 2-4, Suburbia has largest population at night. We can assume the flulike is spread because of person-to-person transmission method on the way back home. To approve this assumption, some visualization can be built. From the figure 2-5, 2-6 and 2-7, which shows the distribution of flulike people on May 18th 5PM, 6PM and 7PM separately. We can find that the numbers of flulike people in the area with large population density at night increase obviously from May 18th 6PM.
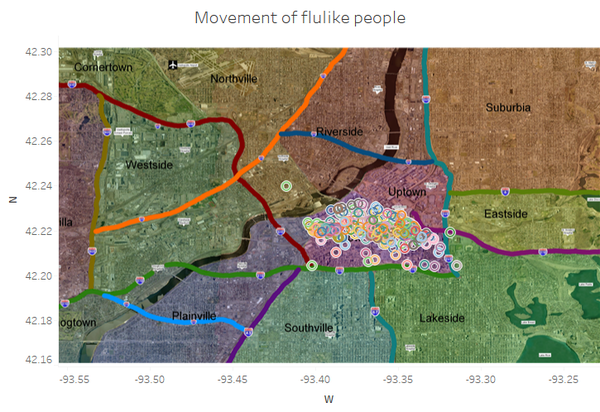
In order to double check this transmission type, we can extract the flulike people who sent messages on 8AM to 9AM and then visualize their location and movement during 6PM to 12PM period. The figure 2-8 shows the location of flulike people appears on 8AM and Figure 2-9 indicates their movement from 6PM. We can see they are not concentrated on Downtown area but located on the surrounding area instead.
2.Airborne transmission method
However, compared with population density, the differences between population in the day and night just occupy a little percentage of whole population, which may not lead to large increase in some areas. Further, before 6pm, the numbers of flulike people also increase in other area (Figure 2-10). Hence, this might due to the airborne transmission method. Based on the weather information, the wind is blowing from West to East on May 18th and it is similar with the diverge direction of microblogs related to flulike symptoms.
The numbers of flulike people in first outbreak decreased abruptly from midnight on May 18th and no further rapid increase in these area. Hence, the first outbreak has been contained.
The second outbreak
Waterborne transmission method
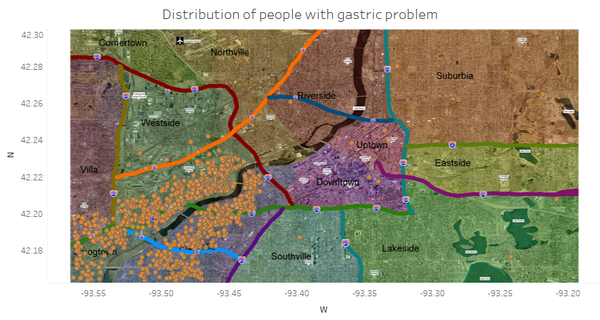
The second outbreak related to gastric problem locates along the Vastriver (Figure 2-11), refer to the information that residents in Vastopolis get drinking water by pumping water from nearby reservoirs or rivers, the most possible transmission method is due to water.
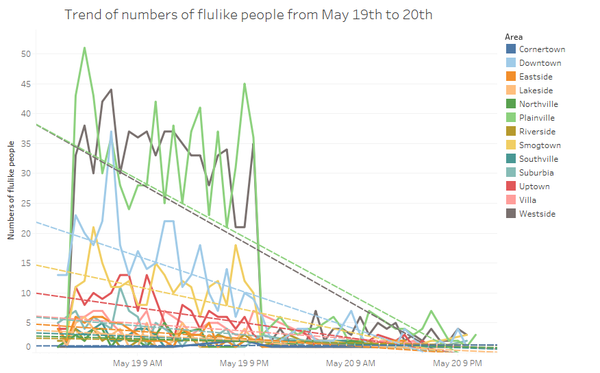
For this reason, in order to prevent diffusion, it is necessary for emergency management personnel to deploy treatment resources for the downstream area follow by Smogtown along the Vastriver. In addition, it is important to control the origin of the river (probably the area in the red circle), where has been polluted by people with flulike. Refer to the Figure 2-12, the numbers of flulike people based on calculating microblogs containing symptom related to second outbreak diminish abruptly on the end of May 19th and no increasing trend on May 20th. Hence, second outbreak is contained.

