Difference between revisions of "ISSS608 2017-18 T1 Assign ZHANG PENG"
| (24 intermediate revisions by the same user not shown) | |||
| Line 1: | Line 1: | ||
| + | <div style=background:#468499 border:#A3BFB1> | ||
| + | [[Image:ZP_title1111.jpg|250px]] | ||
| + | <font size = 5; color="#FFFFFF">Epidemic Spread in Smartpolis</font> | ||
| + | </div> | ||
| + | <!--MAIN HEADER --> | ||
| + | |||
<!--- Challenge Introduction ---> | <!--- Challenge Introduction ---> | ||
= Overview = | = Overview = | ||
| − | < | + | <table width=90%> |
| − | < | + | <tr><td> |
| − | |||
| − | < | ||
<p align="justify">Smartpolis is a major metropolitan area with a population of approximately two million residents. During the last few days, health professionals at local hospitals have noticed a dramatic increase in reported illnesses. Observed symptoms are largely flu¬like and include fever, chills,sweats, aches and pains, fatigue, coughing, breathing difficulty, nausea and vomiting, diarrhea, and enlarged lymph nodes. More recently, there have been several deaths believed to be associated with the current outbreak. City officials fear a possible epidemic and are mobilizing emergency management resources to mitigate the impact.</p> | <p align="justify">Smartpolis is a major metropolitan area with a population of approximately two million residents. During the last few days, health professionals at local hospitals have noticed a dramatic increase in reported illnesses. Observed symptoms are largely flu¬like and include fever, chills,sweats, aches and pains, fatigue, coughing, breathing difficulty, nausea and vomiting, diarrhea, and enlarged lymph nodes. More recently, there have been several deaths believed to be associated with the current outbreak. City officials fear a possible epidemic and are mobilizing emergency management resources to mitigate the impact.</p> | ||
| − | <p>Our Tasks</p> | + | </td></tr> |
| + | <tr><td> | ||
| + | <p><b>Our Tasks</b></p> | ||
<p><b>Task 1:</b></p> | <p><b>Task 1:</b></p> | ||
<ul> | <ul> | ||
| Line 15: | Line 21: | ||
<li>Present a hypothesis on how the infection is being transmitted. For example, is the method of transmission person-¬to¬-person, airborne, waterborne, or something else? Identify the trends that support your hypothesis.</li> | <li>Present a hypothesis on how the infection is being transmitted. For example, is the method of transmission person-¬to¬-person, airborne, waterborne, or something else? Identify the trends that support your hypothesis.</li> | ||
<li>Is the outbreak contained? Is it necessary for emergency management personnel to deploy treatment resources outside the affected area? </li> | <li>Is the outbreak contained? Is it necessary for emergency management personnel to deploy treatment resources outside the affected area? </li> | ||
| + | </ul> | ||
| + | </td></tr> | ||
| + | </table> | ||
<br> | <br> | ||
<!-------------------------> | <!-------------------------> | ||
| Line 20: | Line 29: | ||
= Data Description = | = Data Description = | ||
| − | |||
<table width=90%> | <table width=90%> | ||
<tr> | <tr> | ||
| Line 37: | Line 45: | ||
</td> | </td> | ||
<td> | <td> | ||
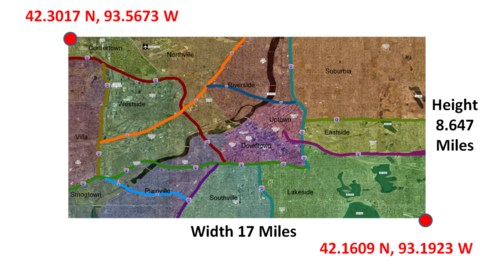
| − | [[File:ZP MAP.png| | + | [[File:ZP MAP.png|left|500 px]] |
| + | </td> | ||
| + | </tr> | ||
| + | <tr> | ||
| + | <td><b>3 Population Statistics</b></td> | ||
| + | <td><b>4 Observed Weather</b></td> | ||
| + | </tr> | ||
| + | <tr> | ||
| + | <td>The provided CSV file contains a number of population statistics. | ||
| + | Attributes: | ||
| + | <ul> | ||
| + | <li>Zone_Name – the name of one of the 13 city zones within the metropolitan area</li> | ||
| + | <li>Population_Density – the number of residents in the zone</li> | ||
| + | <li>Daytime_Population – the estimated population in the zone due to commuting during work hours</li> | ||
| + | </ul> | ||
| + | </td> | ||
| + | <td>The provided CSV file contains a number of weather statistics. | ||
| + | Attributes: | ||
| + | <ul> | ||
| + | <li>Date – date of observed weather by weather station</li> | ||
| + | <li>Weather – weather conditions for a particular day</li> | ||
| + | <li>Average_Wind_Speed – measured in miles per hour</li> | ||
| + | <li>Wind_Direction – the direction from which the wind is blowing or from which it originates</li> | ||
| + | </ul> | ||
</td> | </td> | ||
</tr> | </tr> | ||
</table> | </table> | ||
| − | < | + | <p><b>5 Additional Information</b></p> |
| + | <ul> | ||
| + | <li>Economy – The economy of Vastopolis is based on commerce, entertainment, finance, trucking services, shipping services, health care, and industry.</li> | ||
| + | <li>Water Supply - Residents and businesses get their drinking water by pumping water from nearby reservoirs or rivers. These distributed water systems are both public and privately owned.</li> | ||
| + | <li>Entertainment – Vastopolis has two stadiums (Vastopolis Dome and Westside Stadium) for sports, concerts, and other events. The various lakes and the Vast River, which flows south at a steady rate of three miles per hour, is used for water-based sports and recreation.</li> | ||
| + | <li>City Administration – Vastopolis has several locations of significance including a state courthouse, a capitol building, convention center, and a large airport.</li> | ||
| + | </ul> | ||
<br> | <br> | ||
<!-------------------------> | <!-------------------------> | ||
| Line 48: | Line 85: | ||
= Data Preparation = | = Data Preparation = | ||
| − | <table></table> | + | <table> |
| + | <tr><td> | ||
| + | <p><b>1 Prepare keywords for Microblogs texts</b></p> | ||
| + | <p align="justify">Microblogs’ texts contain a large amount of useless information. To filter out useful and related information from texts, keywords should be designed for efficient filtering. I chose observed symptoms as keywords to filter out related Microblogs by using JMP. The observed symptoms contain chills, sweats, aches and pains, fatigue, coughing, breathing difficulty, nausea and vomiting, diarrhea, and enlarged lymph nodes. I use the symptom-related keywords and frequency of these words to do the deep research.</p> | ||
| + | <p><b>Keywords: </b>'vomit,vomiting', 'sweats', 'pains,painful,pain', 'nausea', 'flu', 'fatigue', 'diarrhea', 'cough,coughing', 'chills', 'stomach', 'breath,breathing', 'ache,headache,aches'</p> | ||
| + | </td></tr> | ||
| + | <tr><td> | ||
| + | <p><b>2 Categorise data to each keyword</b></p> | ||
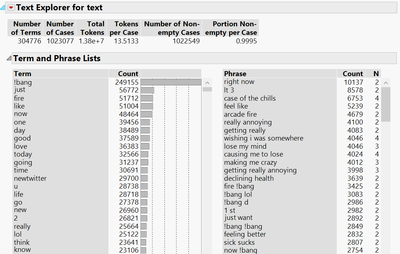
| + | <p align="justify">At first, I used JMP text explorer function to analyse words in column of ‘text’.</p> | ||
| + | <p>[[File:ZP DP1.png|left|400 px]]</p> | ||
| + | </td></tr> | ||
| + | <tr><td> | ||
| + | <p>Then, I searched for each keyword. As a result, we can find the keyword and the count of its frequency. Furthermore, we select out all the rows which contain keywords.</p> | ||
| + | <p>[[File:ZP DP3.PNG|left|400 px]]</p> | ||
| + | </td></tr> | ||
| + | <tr><td> | ||
| + | <p>The last step is to concatenate filtered data together. </p> | ||
| + | <p>[[File:ZP DP2.png|left|400 px]]</p> | ||
| + | </td></tr> | ||
| + | <tr><td> | ||
| + | <p><b>3 Set longitude and latitude</b></p> | ||
| + | <p align="justify">To build map graph for further analysis, the location should be separated. I named the longitude as Location_X and named latitude as Location_Y. Because the longitude in west is negative, the minus one should be multiplied.</p> | ||
| + | <p>[[File:ZP DP4.PNG|left|400 px]]</p> | ||
| + | </td></tr> | ||
| + | <tr><td> | ||
| + | <p><b>4 Build Map background in Tableau</b></p> | ||
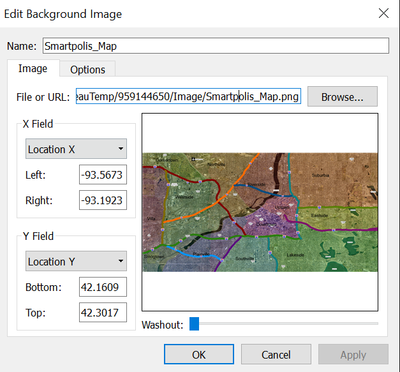
| + | <p align="justify">The background map should be edited so that we can match each point on the map.</p> | ||
| + | <p>[[File:ZP DP5.png|left|400 px]]</p> | ||
| + | </td></tr> | ||
| + | </table> | ||
<!-------------------------> | <!-------------------------> | ||
| Line 54: | Line 120: | ||
= Interactive Visualization = | = Interactive Visualization = | ||
| − | You may have your own investigation here: | + | You may have your own investigation here: https://public.tableau.com/profile/zhang.peng8803#!/vizhome/keyword2/EpidemicSpreadStory?publish=yes |
| + | <br> | ||
<br> | <br> | ||
<!------------------------> | <!------------------------> | ||
<!--- Patterns of Life Analysis ---> | <!--- Patterns of Life Analysis ---> | ||
| + | |||
= Analysis Results = | = Analysis Results = | ||
== Question 1 == | == Question 1 == | ||
<table> | <table> | ||
| + | <tr><td> | ||
| + | '''<big><p><i>Part 1:Identify approximately where the outbreak started on the map (ground zero location). Outline the affected area. Explain how you arrived at your conclusion. </i></p></big>''' | ||
| + | </td></tr> | ||
<tr><td> | <tr><td> | ||
<p align="justify"><b>1. Filter keywords from Microblogs texting</b></p> | <p align="justify"><b>1. Filter keywords from Microblogs texting</b></p> | ||
| Line 99: | Line 170: | ||
<table> | <table> | ||
<tr><td> | <tr><td> | ||
| − | <p><i>Part 1: Present a hypothesis on how the infection is being transmitted. For example, is the method of transmission person-¬to¬-person, airborne, waterborne, or something else? Identify the trends that support your hypothesis.</i></p> | + | '''<big><p><i>Part 1: Present a hypothesis on how the infection is being transmitted. For example, is the method of transmission person-¬to¬-person, airborne, waterborne, or something else? Identify the trends that support your hypothesis.</i></p></big>''' |
</td></tr> | </td></tr> | ||
<tr><td> | <tr><td> | ||
| Line 157: | Line 228: | ||
</td></tr> | </td></tr> | ||
<tr><td> | <tr><td> | ||
| − | <p><i>Part 2: Is the outbreak contained? Is it necessary for emergency management personnel to deploy treatment resources outside the affected area? Explain your reasoning.</i></p> | + | '''<big><p><i>Part 2: Is the outbreak contained? Is it necessary for emergency management personnel to deploy treatment resources outside the affected area? Explain your reasoning.</i></p></big>''' |
</td></tr> | </td></tr> | ||
<tr><td> | <tr><td> | ||
| Line 165: | Line 236: | ||
</td></tr> | </td></tr> | ||
<tr><td> | <tr><td> | ||
| − | <p align="justify">As we saw from the graph, people who have stomach-ache on May 18 still stayed in the same areas neither went to the hospital nor went to work.</p> | + | <p align="justify">As we saw from the graph, people who have stomach-ache on May 18 still stayed in the same areas neither went to the hospital nor went to work. This symptom will not be more seriously because they even not went to the hospital.</p> |
<p>[[File:ZP FINDING15.png|left|Figure 15|500 px]]</p> | <p>[[File:ZP FINDING15.png|left|Figure 15|500 px]]</p> | ||
</td></tr> | </td></tr> | ||
</table> | </table> | ||
<!--- Discussion ---> | <!--- Discussion ---> | ||
Latest revision as of 23:15, 15 October 2017
Contents
Overview
|
Smartpolis is a major metropolitan area with a population of approximately two million residents. During the last few days, health professionals at local hospitals have noticed a dramatic increase in reported illnesses. Observed symptoms are largely flu¬like and include fever, chills,sweats, aches and pains, fatigue, coughing, breathing difficulty, nausea and vomiting, diarrhea, and enlarged lymph nodes. More recently, there have been several deaths believed to be associated with the current outbreak. City officials fear a possible epidemic and are mobilizing emergency management resources to mitigate the impact. |
|
Our Tasks Task 1:
Task 2:
|
Data Description
| 1 Microblog Messages | 2 Map |
| The provided CSV file contains a number of microblog messages.
Attributes:
|
|
| 3 Population Statistics | 4 Observed Weather |
| The provided CSV file contains a number of population statistics.
Attributes:
|
The provided CSV file contains a number of weather statistics.
Attributes:
|
5 Additional Information
- Economy – The economy of Vastopolis is based on commerce, entertainment, finance, trucking services, shipping services, health care, and industry.
- Water Supply - Residents and businesses get their drinking water by pumping water from nearby reservoirs or rivers. These distributed water systems are both public and privately owned.
- Entertainment – Vastopolis has two stadiums (Vastopolis Dome and Westside Stadium) for sports, concerts, and other events. The various lakes and the Vast River, which flows south at a steady rate of three miles per hour, is used for water-based sports and recreation.
- City Administration – Vastopolis has several locations of significance including a state courthouse, a capitol building, convention center, and a large airport.
Data Preparation
|
1 Prepare keywords for Microblogs texts Microblogs’ texts contain a large amount of useless information. To filter out useful and related information from texts, keywords should be designed for efficient filtering. I chose observed symptoms as keywords to filter out related Microblogs by using JMP. The observed symptoms contain chills, sweats, aches and pains, fatigue, coughing, breathing difficulty, nausea and vomiting, diarrhea, and enlarged lymph nodes. I use the symptom-related keywords and frequency of these words to do the deep research. Keywords: 'vomit,vomiting', 'sweats', 'pains,painful,pain', 'nausea', 'flu', 'fatigue', 'diarrhea', 'cough,coughing', 'chills', 'stomach', 'breath,breathing', 'ache,headache,aches' |
|
2 Categorise data to each keyword At first, I used JMP text explorer function to analyse words in column of ‘text’. |
|
Then, I searched for each keyword. As a result, we can find the keyword and the count of its frequency. Furthermore, we select out all the rows which contain keywords. |
|
The last step is to concatenate filtered data together. |
|
3 Set longitude and latitude To build map graph for further analysis, the location should be separated. I named the longitude as Location_X and named latitude as Location_Y. Because the longitude in west is negative, the minus one should be multiplied. |
|
4 Build Map background in Tableau The background map should be edited so that we can match each point on the map. |
Interactive Visualization
You may have your own investigation here: https://public.tableau.com/profile/zhang.peng8803#!/vizhome/keyword2/EpidemicSpreadStory?publish=yes
Analysis Results
Question 1
|
Part 1:Identify approximately where the outbreak started on the map (ground zero location). Outline the affected area. Explain how you arrived at your conclusion. |
|
1. Filter keywords from Microblogs texting I chose observed symptoms as keywords to filter out related Microblogs by using JMP. The observed symptoms contain chills, sweats, aches and pains, fatigue, coughing, breathing difficulty, nausea and vomiting, diarrhea, and enlarged lymph nodes. I use the symptom-related keywords and frequency of these words to improve accuracy. |
|
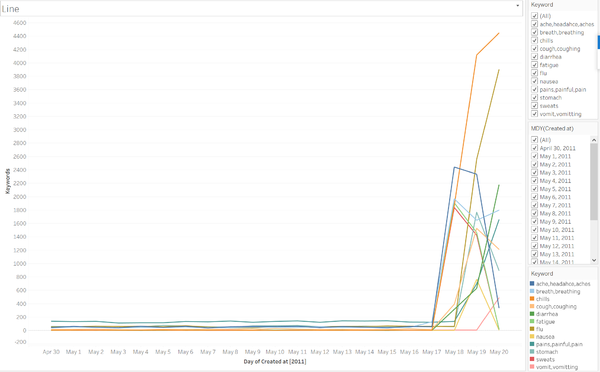
2. Find out the outbreak time We can find all the symptoms are sharply increased from May 18 and partial from May 19 in below line-chart. I only need to do deep analysis from May 17 to May 20. |
|
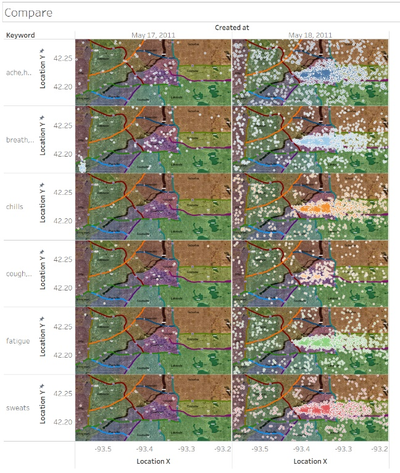
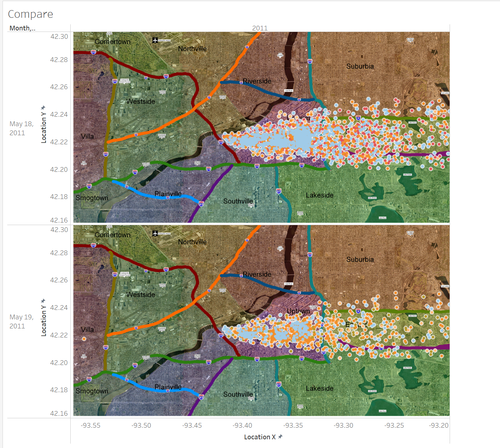
3. Find out the affected areas The symptom words used on May 18 are related to aches, breath, chills, cough, fatigue and sweats. These symptoms outbroke mainly in Uptown, Downtown and Eastside. |
|
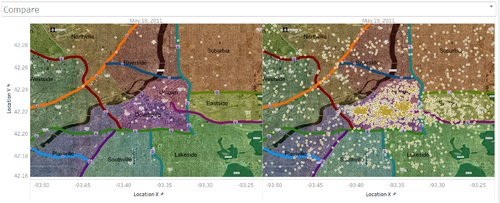
The symptom in Uptown, Downtown and Eastside is like flu. So that on May 19, in the same place, the word ‘flu’ was used more frequently. (Figure3: Compare flu frequency on May 18 and May 19).
|
|
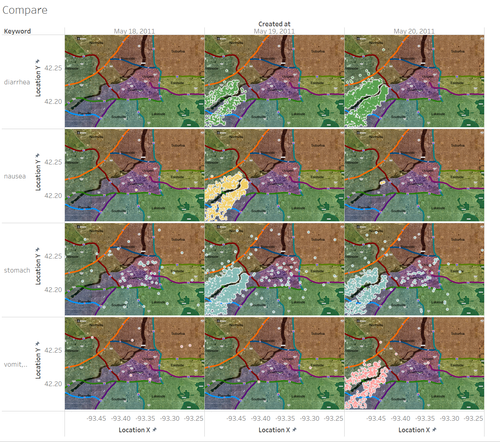
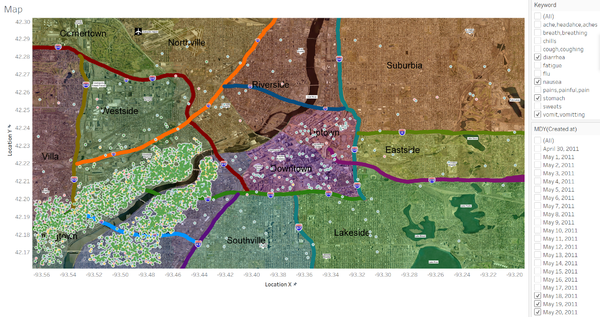
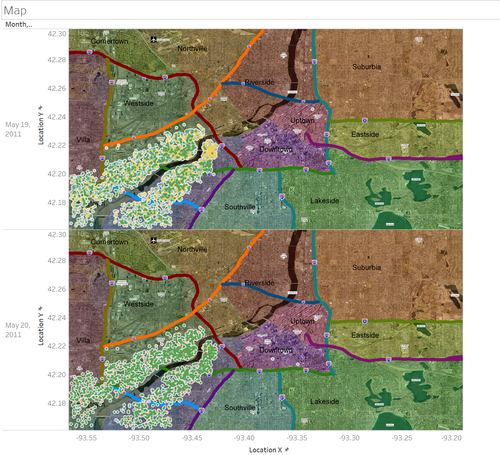
Conclusion1: The first affected area is clustered near the centre as Uptown, Downtown. The symptom is like flu. However, other different partial symptoms are clustered near downstream in Southville and Smogtown on May 19 and May 20. They are diarrhea, nausea, stomach and vomit. We find out that it is a like stomach-ache symptom. (Figure4)
|
|
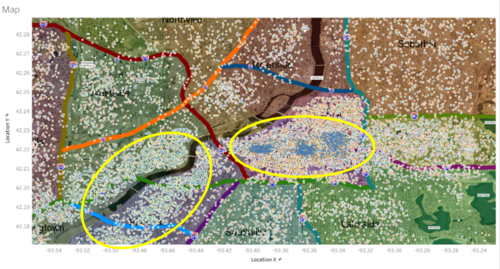
Conclusion2: The second affected area is near downstream in Plainville and Smogtown one day later than the first affected area. The symptom is like stomach ache. Combine conclusion 1 and conclusion 2, we can achieve that the first outbreak area is near the centre. The second outbreak area is near downstream of the river. The symptoms in these two areas are totally different. |
Question 2
|
Part 1: Present a hypothesis on how the infection is being transmitted. For example, is the method of transmission person-¬to¬-person, airborne, waterborne, or something else? Identify the trends that support your hypothesis. |
|
1. Flu-like symptom and Stomach-ache are transmitted by different way Reason: From Q1 we achieved that there are two different symptoms. The first is a flu-like symptom and the second is a stomach-ache like symptom. In the second and third day of outbreak, people in Downtown and Uptown did not have the same symptom as stomach-ache. In another word, stomach-ache infection will not spread to other places. |
|
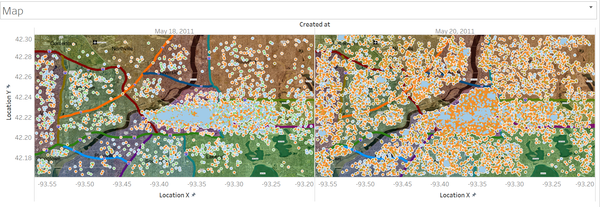
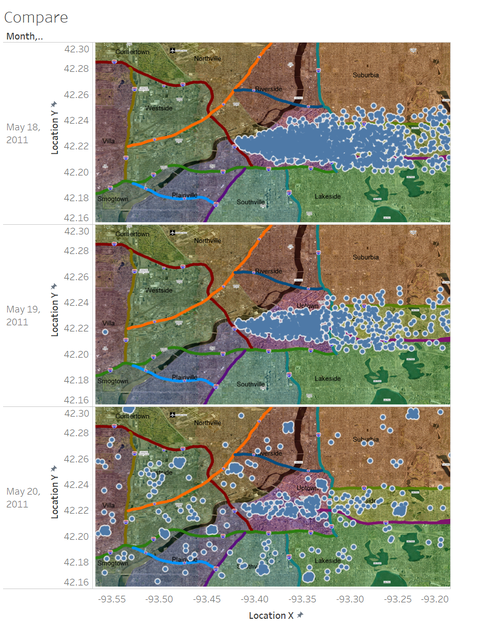
The stomach-ache like symptom is limited in the same areas and did not affect other areas. However, by comparing the flu-like symptom in the first outbreak day and the last day, the flu-like symptom has been affected to the whole country. As a result, we can conclude that Flu-like symptom and Stomach-ache infections are transmitted by different way. Moreover, we need to analyse these two symptoms separately. |
|
2. The stomach-ache symptom is more likely transmitted by waterborne
The answer is yes. On May 18, the stomach-ache like symptom was outbreak near both sides of the river near the downstream simultaneously. This trend corresponded with the flow of river from North to South. In fact, the stomach-ache is always caused by food or water as a common sense. Residents and businesses get their drinking water by pumping water from nearby reservoirs or rivers. As a result, stomach-ache symptom has a high possibility of spread by waterborne. |
The answer is no. the day time population in Plainvile is smaller than night which means many working people would back to Plainvile on May19. However, on May20, these people back to work and they are not affected. Stomach-ache symptom is only limited under downstreaming. |
The answer is no. Although the direction of wind is nearly from west to east, Southville and Lakeside areas did not find any symptom like stomach-ache symptom. |
|
3. The flu-like symptom is more likely transmitted by person-to-person and airborne
The answer is no. To analyse the symptom more deeply, I used the graph to see the distribution in each hour on May 18 and selected out the most significant hours such as 7, 8, 17 and 18 o’clock. We can find out that the outbreak is start around at 8 o’clock clustered in Downtown, Uptown and a few in Eastside. These three affected areas are on the right of the river. However, on the left side of the river, the areas which are opposite to Downtown and Uptown are not affected at the same time during 8 o’clock to 17 o’clock. As a result, the flu-like symptom is not affected by waterborne. |
My answer is yes. As we can see from the above graph, from 8~17 o’clock the affected area is not changed. However, after 18 o’clock, people started to send related messages in many other areas. I guess the reason is that from 8-17 o’clock is the work time, after 18 people start to back home. To prove this, I selected out the ID from affected area in Downtown, Uptown and Westside. |
|
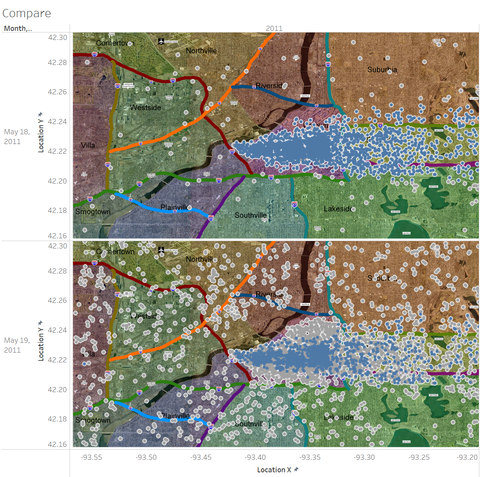
As we can see from the following graph, these selected people were also in the same area from 8~17 o’clock on May 18 and May 19. |
|
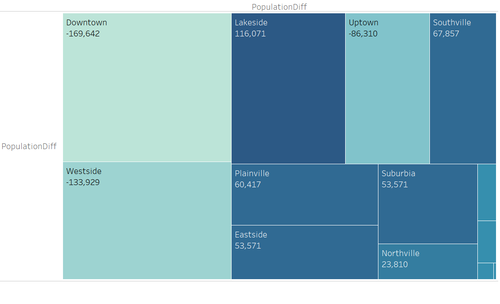
After 17 o’clock, these people in affected area would back to home. This result can be roughly concluded by the population distribution. Many people after work will leave Uptown and Downtown and go back to Lakeside, Plainville, Suburbia. |
|
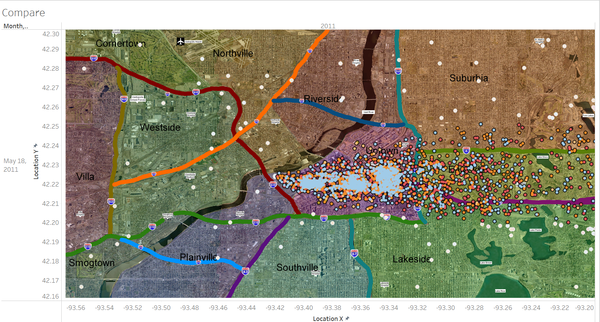
Now let’s compared the selected people and the total affected people who have flu-like symptom during 8~17 o’clock on May 18 and May19. (The deep blue points are the infected people on May 18, they will also be emphasized by deep blue on May 19 if they also sent the message) We can find that although the infected people would go back to work on May 19 and stayed in the same areas, but other areas such as Riverside, Villa and so on were also affected. The highly convincing explanation is that the infected people back to home from centre areas and spread the disease to their friends and families. As a result, the flu-like symptom can spread person to person. |
The answer is that it depends on different conditions. As we have been analysed that the starting point which caused stomach-ache symptom is near the river beside the bound of Downtown and Plainville. |
|
Condition 1: If the stomach-ache like symptom and flu-like symptom are caused by the same infection and the different symptoms are caused by different disseminators, the airborne will have high possibility to spread infection. Because the wind from west to east on May 18, 19 is coordinate to the direction of the spread. The spread was start from the river beside the bound of Downtown and Plainville, then moved to Downtown, to Uptown and Eastside. Condition 2: If these two symptoms are caused by different infections, the cause of flu-like symptom may breakout in the centre of Downtown and Uptown. We cannot judge whether it can be transmitted by airborne. |
|
Part 2: Is the outbreak contained? Is it necessary for emergency management personnel to deploy treatment resources outside the affected area? Explain your reasoning. |
|
The outbreak of flu-like symptom is not contained. Although the outbreak started from the Downtown, Uptown and Eastside, all areas were affected. Furthermore, I selected people who are infected by flu-like epidemic from 8~17 o’clock on May 18. We can find on May 19 during 8~17 o’clock, these people back to work which meanings they can insist to work. However, on May 20, many of them went to the hospital in each area which presented the epidemic was becoming much more seriously. To prevent the flu-like symptom to grow much more quickly and more severely, emergency management personnel to deploy treatment resources outside the affected area is necessary. |
|
As we saw from the graph, people who have stomach-ache on May 18 still stayed in the same areas neither went to the hospital nor went to work. This symptom will not be more seriously because they even not went to the hospital. |

