Difference between revisions of "ISS608 2017-18 T1 Assign KyonghwanKim Data Preparation"
Kh.kim.2016 (talk | contribs) |
Kh.kim.2016 (talk | contribs) |
||
| (4 intermediate revisions by the same user not shown) | |||
| Line 1: | Line 1: | ||
[[file:title.png]] | [[file:title.png]] | ||
| − | <div style=background:# | + | <div style=background:#8B8B8B border:#8B8B8B> |
<font size = 6; color="#000000">Vastropolis Epidemic Report</font> | <font size = 6; color="#000000">Vastropolis Epidemic Report</font> | ||
</div> | </div> | ||
| Line 6: | Line 6: | ||
<!--MAIN HEADER --> | <!--MAIN HEADER --> | ||
{|style="background-color:#B4CE20;" width="100%" cellspacing="0" cellpadding="0" valign="top" border="0" | | {|style="background-color:#B4CE20;" width="100%" cellspacing="0" cellpadding="0" valign="top" border="0" | | ||
| − | | style="font-family:Century Gothic; font-size:100%; solid #000000; background:# | + | | style="font-family:Century Gothic; font-size:100%; solid #000000; background:#8B8B8B; text-align:center;" width="20%" | |
; | ; | ||
[[ISS608_2017-18_T1_Assign_KyonghwanKim| <font color="#000000">Background</font>]] | [[ISS608_2017-18_T1_Assign_KyonghwanKim| <font color="#000000">Background</font>]] | ||
| − | | style="font-family:Century Gothic; font-size:100%; solid # | + | | style="font-family:Century Gothic; font-size:100%; solid #8B8B8B; background:#EEDB1A; text-align:center;" width="20%" | |
; | ; | ||
[[ISS608_2017-18_T1_Assign_KyonghwanKim_Data_Preparation| <font color="#000000">Data Preparation</font>]] | [[ISS608_2017-18_T1_Assign_KyonghwanKim_Data_Preparation| <font color="#000000">Data Preparation</font>]] | ||
| − | | style="font-family:Century Gothic; font-size:100%; solid # | + | | style="font-family:Century Gothic; font-size:100%; solid #8B8B8B; background:#8B8B8B; text-align:center;" width="20%" | |
; | ; | ||
[[ISS608_2017-18_T1_Assign_KyonghwanKim_Visualization| <font color="#000000">Visualization</font>]] | [[ISS608_2017-18_T1_Assign_KyonghwanKim_Visualization| <font color="#000000">Visualization</font>]] | ||
| − | | style="font-family:Century Gothic; font-size:100%; solid # | + | | style="font-family:Century Gothic; font-size:100%; solid #8B8B8B; background:#8B8B8B; text-align:center;" width="20%" | |
; | ; | ||
| − | [[ISS608_2017- | + | [[ISS608_2017-18_T1_Assign_KyonghwanKim_Solution| <font color="#000000">Solution</font>]] |
| − | | style="font-family:Century Gothic; font-size:100%; solid # | + | | style="font-family:Century Gothic; font-size:100%; solid #8B8B8B; background:#8B8B8B; text-align:center;" width="20%" | |
| − | |||
| − | |||
| − | |||
| − | |||
; | ; | ||
[[Talk:ISS608_2017-18_T1_Assign_KyonghwanKim_Feedback| <font color="#000000">Feedback</font>]] | [[Talk:ISS608_2017-18_T1_Assign_KyonghwanKim_Feedback| <font color="#000000">Feedback</font>]] | ||
| Line 33: | Line 29: | ||
|} | |} | ||
<br/> | <br/> | ||
| − | |||
| Line 62: | Line 57: | ||
[[file:outbreak.png|400px]] | [[file:outbreak.png|400px]] | ||
| − | + | Key word ''"flu"'' and ''"cold"'' are chosen as they are diagnosis words whereas other words are symptoms. Above graph shows the text distribution by "Date" that contains diagnosis words. Text traffic shoots up from May 18th and remain high until 20th. Word Cloud during 3 days of outbreak using JMP text explorer are shown below. | |
[[file:cloud.png|300px]] | [[file:cloud.png|300px]] | ||
| − | Therefore, following key are | + | Therefore, following key words are chosen for analysis. |
*Given: '''''flu''''', fever, chill(s), sweat(s), <span style="color: blue"><del>aches</del></span>, pain(s), fatigue, cough(ing), ''breathing difficulty'', nausea, vomit(ing), diarrhea, ''enlarged lymph nodes'' | *Given: '''''flu''''', fever, chill(s), sweat(s), <span style="color: blue"><del>aches</del></span>, pain(s), fatigue, cough(ing), ''breathing difficulty'', nausea, vomit(ing), diarrhea, ''enlarged lymph nodes'' | ||
*Enhanced: '''''cold''''', <span style="color: blue">headache</span>, sick, ''shortness of breath'', ''declining health'', ''hurts to move'', ''aching muscles'', ''sore throat'', ''runny nose'', ''problems breathing'', pneumonia | *Enhanced: '''''cold''''', <span style="color: blue">headache</span>, sick, ''shortness of breath'', ''declining health'', ''hurts to move'', ''aching muscles'', ''sore throat'', ''runny nose'', ''problems breathing'', pneumonia | ||
| Line 72: | Line 67: | ||
==3. Contagion Flag== | ==3. Contagion Flag== | ||
Text containing above 23 words and phrases are chosen from dataset '''''"Microblog_Final.csv"'''''. | Text containing above 23 words and phrases are chosen from dataset '''''"Microblog_Final.csv"'''''. | ||
| + | |||
| + | [[file:contagion_flag.png]] | ||
| + | |||
| + | '''Diagnosis Flag''' is text containing diagnosis words: ''"flu"'' and ''"cold"''. '''Symptom Flag''' is text containing at least 2 of all other key words apart from diagnosis words. Any text containing at least 1 of Diagnosis words or at least 2 of Symptom words are classified as '''Contagion Flag''' (20,466 rows) which is used for Visualization analysis. '''''"Contagion_Flag.csv"''''' | ||
Latest revision as of 23:13, 15 October 2017
Vastropolis Epidemic Report
|
|
|
|
|
|
Microblog
1. Data cleaning
2. Key Words
Some of key words are given. However, there may be additional key words to enhance accuracy of analysis.
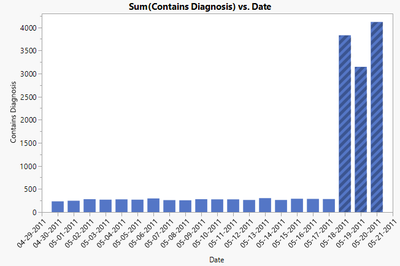
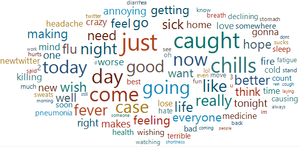
Key word "flu" and "cold" are chosen as they are diagnosis words whereas other words are symptoms. Above graph shows the text distribution by "Date" that contains diagnosis words. Text traffic shoots up from May 18th and remain high until 20th. Word Cloud during 3 days of outbreak using JMP text explorer are shown below.
Therefore, following key words are chosen for analysis.
- Given: flu, fever, chill(s), sweat(s),
aches, pain(s), fatigue, cough(ing), breathing difficulty, nausea, vomit(ing), diarrhea, enlarged lymph nodes - Enhanced: cold, headache, sick, shortness of breath, declining health, hurts to move, aching muscles, sore throat, runny nose, problems breathing, pneumonia
3. Contagion Flag
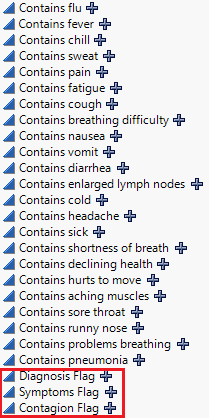
Text containing above 23 words and phrases are chosen from dataset "Microblog_Final.csv".
Diagnosis Flag is text containing diagnosis words: "flu" and "cold". Symptom Flag is text containing at least 2 of all other key words apart from diagnosis words. Any text containing at least 1 of Diagnosis words or at least 2 of Symptom words are classified as Contagion Flag (20,466 rows) which is used for Visualization analysis. "Contagion_Flag.csv"


