Difference between revisions of "ISSS608 2017-18 T1 Assign FOO CELONG RAYMOND/IdentifyGroundZero"
| (38 intermediate revisions by the same user not shown) | |||
| Line 6: | Line 6: | ||
<table style="width:900px;"> | <table style="width:900px;"> | ||
<tr> | <tr> | ||
| − | <td width="40%" style="color:#ffffff;text-align:left;font-size: 18px;">[[ISSS608_2017-18_T1_Assign_FOO_CELONG_RAYMOND/ | + | <td width="40%" style="color:#ffffff;text-align:left;font-size: 18px;">[[ISSS608_2017-18_T1_Assign_FOO_CELONG_RAYMOND/Preliminary|< Preliminary]]</td> |
<td width="20%" style="color:#ffffff;text-align:center;font-size: 18px;">[[ISSS608_2017-18_T1_Assign_FOO_CELONG_RAYMOND|Home]]</td> | <td width="20%" style="color:#ffffff;text-align:center;font-size: 18px;">[[ISSS608_2017-18_T1_Assign_FOO_CELONG_RAYMOND|Home]]</td> | ||
| − | <td width="40%" style="color:#ffffff;text-align:right;font-size: 18px;"></td> | + | <td width="40%" style="color:#ffffff;text-align:right;font-size: 18px;">[[ISSS608_2017-18_T1_Assign_FOO_CELONG_RAYMOND/DisprovingtheTheories|Disproving the Theories >]]</td> |
</tr> | </tr> | ||
</table> | </table> | ||
| Line 14: | Line 14: | ||
<br \> | <br \> | ||
| − | <div style="color:#0F1940; padding-left: 10px; font-size: | + | <div style="color:#0F1940; padding-left: 10px; font-size: 24px; font-family: 'Helvetica Neue', Helvetica, Arial, sans-serif;">Tracking the Outbreak</div> |
| + | <hr style="margin-left:10px;margin-right:10px"> | ||
<div style="padding-left: 10px; color:#0F1940; font-size: 16px; font-weight: bold; font-family: 'Courier New', Courier, monospace"> | <div style="padding-left: 10px; color:#0F1940; font-size: 16px; font-weight: bold; font-family: 'Courier New', Courier, monospace"> | ||
| + | <p>From my preliminary analysis, I noticed two sets of symptoms which were manifested by population at different time. I will first gather evidence that there is indeed 2 separate outbreaks.</p> | ||
| + | </div> | ||
<br \> | <br \> | ||
| − | [[File: | + | <div style="color:#0F1940; padding-left: 10px; font-size: 24px; font-family: 'Helvetica Neue', Helvetica, Arial, sans-serif;">Evidence of two outbreaks</div> |
| + | <hr style="margin-left:10px;margin-right:10px"> | ||
| + | <div style="padding-left: 10px; color:#0F1940; font-size: 16px; font-weight: bold; font-family: 'Courier New', Courier, monospace"> | ||
| + | [[File:RaymCrossSymptom18May.jpg|800px|center]] | ||
| + | <p>I first gathered microblog posts from people that had posted more than once and had posted at least two different posts containing 2 different symptoms. Next, I plot the percentage of each different symptom being mentioned when a reference symptom was mentioned. From above chart alone, I can tell that the diarrhea, vomit and nausea symptoms are not related to the symptoms in the first outbreak since only a minute percentage of people with symptoms of the first outbreak developed them.</p> | ||
<br \> | <br \> | ||
| − | The | + | [[File:RaymCrossSymptom19May.jpg|800px|center]] |
| + | <p>From the next chart, I can also guess that flu and pain are likely to be symptoms that developed in the later stage of the first outbreak as they are also weakly related to the diarrhea, vomit and nausea symptoms. Furthermore, I also noticed that aches and pain are shared symptoms of both the outbreaks.</p> | ||
| + | </div> | ||
| + | |||
| + | |||
| + | <div style="color:#0F1940; padding-left: 10px; font-size: 24px; font-family: 'Helvetica Neue', Helvetica, Arial, sans-serif;">18 May Outbreak Ground Zero</div> | ||
| + | <hr style="margin-left:10px;margin-right:10px"> | ||
| + | <div style="padding-left: 10px; color:#0F1940; font-size: 16px; font-weight: bold; font-family: 'Courier New', Courier, monospace"> | ||
| + | <p>I know that the first 7 symptoms that were first observed on 18-May are:- | ||
| + | <ul> | ||
| + | <li> Aches</li> | ||
| + | <li> Breathing problem</li> | ||
| + | <li> Chills</li> | ||
| + | <li> Cough</li> | ||
| + | <li> Fatigue</li> | ||
| + | <li> Fever</li> | ||
| + | <li> Sweat</li> | ||
| + | </ul> | ||
| + | </p> | ||
| + | [[File:Raym18MayByZone.jpg|850px|center]] | ||
| + | <p>Downtown is the ground zero of the outbreak because it has the highest number of post across all 7 symptoms. It is also observed that the top 5 city zones are in the same order across all symptoms. Downtown have the highest number of posts followed by uptown, eastside, lakeside and finally suburbia.</p> | ||
| + | [[File:RaymGroundZero1.jpg|850px|center]] | ||
| + | The most affected areas seem to form a cone shape which started from downtown and spreads out towards the east and becomes more diffused as it spreads out. All top 5 city zones in the top with the highest number of symptoms are within the boundary of the cone. | ||
| + | </div> | ||
| + | |||
| + | <div style="color:#0F1940; padding-left: 10px; font-size: 24px; font-family: 'Helvetica Neue', Helvetica, Arial, sans-serif;">19 May Outbreak Ground Zero</div> | ||
| + | <hr style="margin-left:10px;margin-right:10px"> | ||
| + | <div style="padding-left: 10px; color:#0F1940; font-size: 16px; font-weight: bold; font-family: 'Courier New', Courier, monospace"> | ||
| + | <p>Symptoms that were first observed on 19-May are:- | ||
| + | <ul> | ||
| + | <li> Diarrhea</li> | ||
| + | <li> Flu</li> | ||
| + | <li> Nausea</li> | ||
| + | <li> Pain</li> | ||
| + | <li> Vomit</li> | ||
| + | </ul> | ||
| + | </p> | ||
| + | [[File:Raym19MayByZone.jpg|850px|center]] | ||
| + | <p>From the chart, I can see that westside and plainville are the two zones with the highest counts of posts across all 5 symptoms except for flu. I observe that for flu, the top 5 zones are the same as those symptoms presented in the 18-May which suggests that flu is a late occurring symptom from the outbreak in the 18-May.</p> | ||
| + | [[File:RaymGroundZero2.jpg|850px|center]] | ||
| + | <p>The most affected areas seem to form a cone shape which started from north east of plainville and south east of westside, and spread towards the south west, also becoming more diffuse as it spread south west.</p> | ||
| + | </div> | ||
| + | <div style="width:900px; background-color:#c0c0c0; height: 35px; border-bottom: 1px solid #9e9e9e; border-top: 1px solid #9e9e9e;"> | ||
| + | <table style="width:900px;"> | ||
| + | <tr> | ||
| + | <td width="40%" style="color:#ffffff;text-align:left;font-size: 18px;">[[ISSS608_2017-18_T1_Assign_FOO_CELONG_RAYMOND/Preliminary|< Preliminary]]</td> | ||
| + | <td width="20%" style="color:#ffffff;text-align:center;font-size: 18px;">[[ISSS608_2017-18_T1_Assign_FOO_CELONG_RAYMOND|Home]]</td> | ||
| + | <td width="40%" style="color:#ffffff;text-align:right;font-size: 18px;">[[ISSS608_2017-18_T1_Assign_FOO_CELONG_RAYMOND/DisprovingtheTheories|Disproving the Theories >]]</td> | ||
| + | </tr> | ||
| + | </table> | ||
</div> | </div> | ||
</div> | </div> | ||
Latest revision as of 22:52, 15 October 2017
From my preliminary analysis, I noticed two sets of symptoms which were manifested by population at different time. I will first gather evidence that there is indeed 2 separate outbreaks.
I first gathered microblog posts from people that had posted more than once and had posted at least two different posts containing 2 different symptoms. Next, I plot the percentage of each different symptom being mentioned when a reference symptom was mentioned. From above chart alone, I can tell that the diarrhea, vomit and nausea symptoms are not related to the symptoms in the first outbreak since only a minute percentage of people with symptoms of the first outbreak developed them.
From the next chart, I can also guess that flu and pain are likely to be symptoms that developed in the later stage of the first outbreak as they are also weakly related to the diarrhea, vomit and nausea symptoms. Furthermore, I also noticed that aches and pain are shared symptoms of both the outbreaks.
I know that the first 7 symptoms that were first observed on 18-May are:-
- Aches
- Breathing problem
- Chills
- Cough
- Fatigue
- Fever
- Sweat
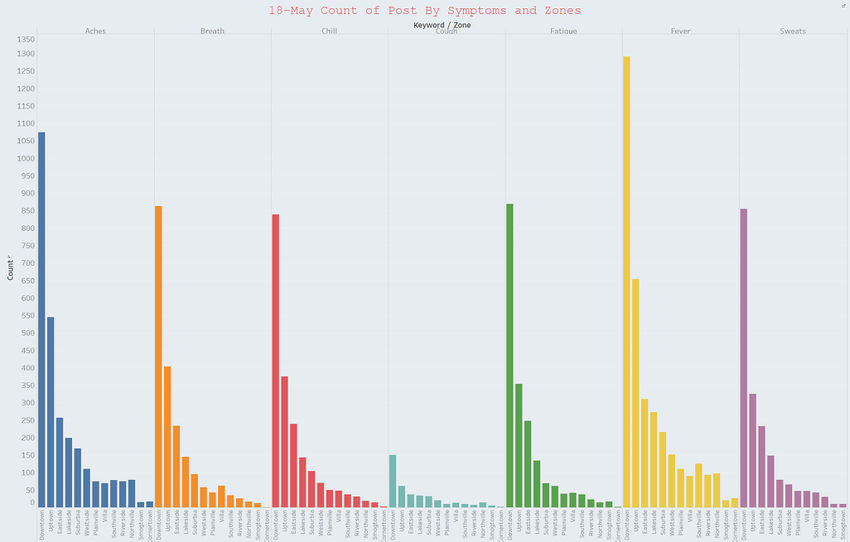
Downtown is the ground zero of the outbreak because it has the highest number of post across all 7 symptoms. It is also observed that the top 5 city zones are in the same order across all symptoms. Downtown have the highest number of posts followed by uptown, eastside, lakeside and finally suburbia.
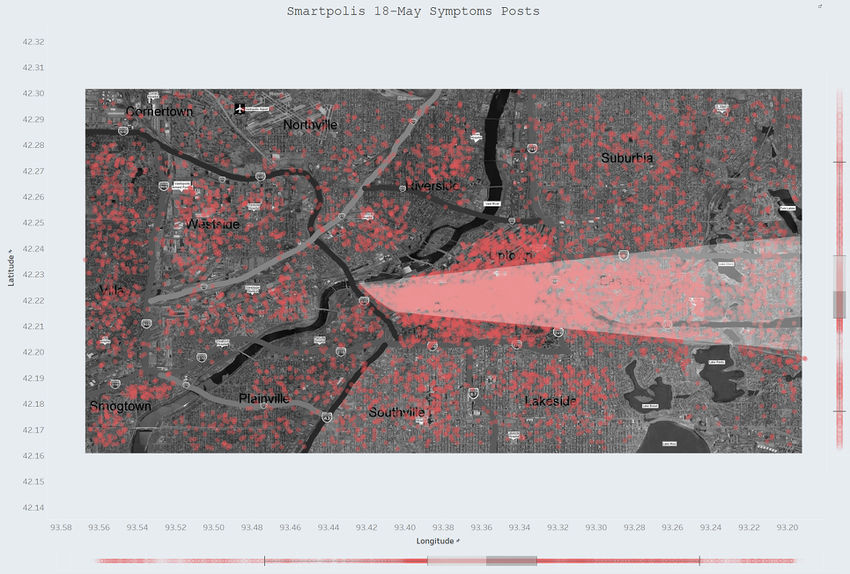
The most affected areas seem to form a cone shape which started from downtown and spreads out towards the east and becomes more diffused as it spreads out. All top 5 city zones in the top with the highest number of symptoms are within the boundary of the cone.
Symptoms that were first observed on 19-May are:-
- Diarrhea
- Flu
- Nausea
- Pain
- Vomit
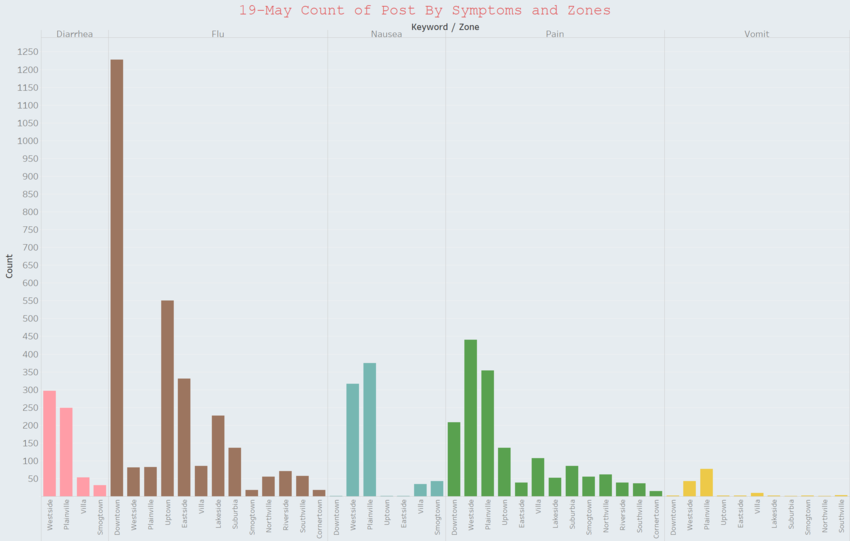
From the chart, I can see that westside and plainville are the two zones with the highest counts of posts across all 5 symptoms except for flu. I observe that for flu, the top 5 zones are the same as those symptoms presented in the 18-May which suggests that flu is a late occurring symptom from the outbreak in the 18-May.
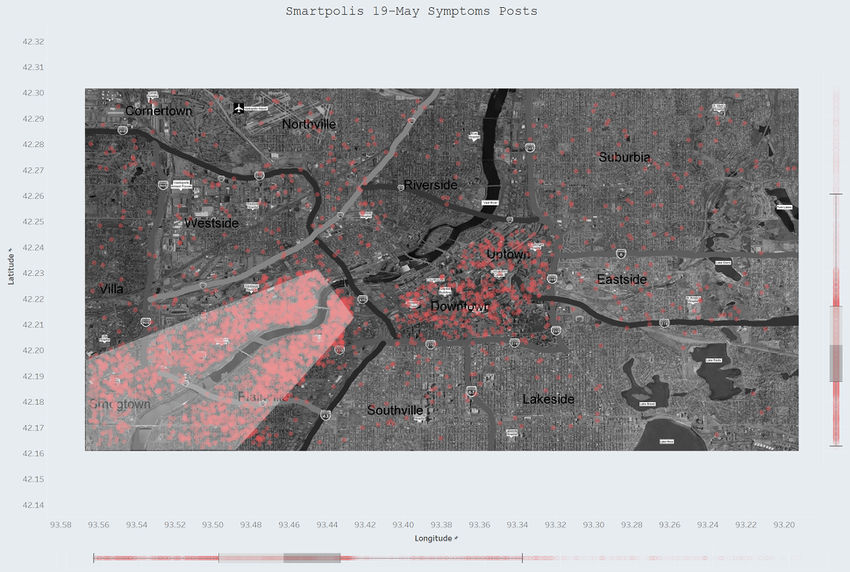
The most affected areas seem to form a cone shape which started from north east of plainville and south east of westside, and spread towards the south west, also becoming more diffuse as it spread south west.


