Difference between revisions of "ISSS608 2017-18 T1 Assign WU YUQING Analysis & Solutions"
| Line 35: | Line 35: | ||
[[Image:yqwu_flu-related_Message_Distribution.png|border|350px]] <br> | [[Image:yqwu_flu-related_Message_Distribution.png|border|350px]] <br> | ||
<font size=2><b>''Distribution of Flu-related Messages By Date''</b></font><br> | <font size=2><b>''Distribution of Flu-related Messages By Date''</b></font><br> | ||
| − | To further identify the origin and the specific time of the outbreak, we can further check the geographical distribution of flu-related messages on May 18th by hour as shown below.<br> | + | To further identify the origin and the specific time of the outbreak, we can further check the geographical distribution of flu-related messages on May 18th by hour and the heatmap on hourly basis as shown below.<br> |
[[Image:yqwu_May18_7AM.png|border|450px]]<br> | [[Image:yqwu_May18_7AM.png|border|450px]]<br> | ||
[[Image:yqwu_May18_8AM.png|border|450px]]<br> | [[Image:yqwu_May18_8AM.png|border|450px]]<br> | ||
[[Image:yqwu_May18_9AM.png|border|450px]]<br> | [[Image:yqwu_May18_9AM.png|border|450px]]<br> | ||
| − | From the geographical distribution of flu-related messages (One yellow point stands for one flu-related message from one user) from 7am to 10am on May 18th, we can see that the number of flu-related microblogs suddenly increased significantly between 8am to 9am on May 18th and kept stable between 9am to 10am and these messages mainly concentrated in the zone of Downtown, Uptown and Eastside, especially the Downtown and southern Uptown. In addition, these messages seem that they concentrated near the Vastopolis Dome (one stadium), Vastopolis City Hospital and Convention Centre.<br> | + | [[Image:yqwu_heatmap.png|border|450px]]<br> |
| + | From the heatmap and geographical distribution of flu-related messages (One yellow point stands for one flu-related message from one user) from 7am to 10am on May 18th, we can see that the number of flu-related microblogs suddenly increased significantly between 8am to 9am on May 18th and kept stable between 9am to 10am and these messages mainly concentrated in the zone of Downtown, Uptown and Eastside, especially the Downtown and southern Uptown. In addition, these messages seem that they concentrated near the Vastopolis Dome (one stadium), Vastopolis City Hospital and Convention Centre.<br> | ||
After the outbreak at 8am, we can find that the epidemic suddenly expanded to the Vast River’s both sides mainly in the zone of Southern Westside and Plainville at 2AM on May 19th, 2011 as shown below. | After the outbreak at 8am, we can find that the epidemic suddenly expanded to the Vast River’s both sides mainly in the zone of Southern Westside and Plainville at 2AM on May 19th, 2011 as shown below. | ||
This is another serious outbreak.<br> | This is another serious outbreak.<br> | ||
Latest revision as of 20:56, 15 October 2017
|
|
|
|
|
|
Analysis & Solutions Tool: JMP Pro & Tableau
Web-based Interactive Data Visualization
Please visit Tableau Public Page of WU Yuqingto check the interactive dashboard.
Question 1: Origin and Epidemic Spread
Identify approximately where the outbreak started on the map (ground zero location). Outline the affected area. Explain how you arrived at your conclusion. (Please limit your answer to six images and 500 words.)
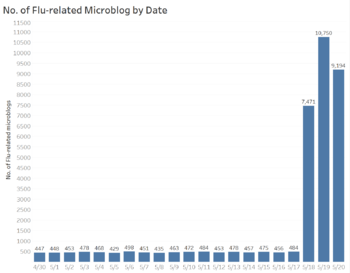
Firstly, from the ‘preprocess.txt’, the messages containing symptoms are used to build the distribution of the number of flu-related messages by date as shown below. From the distribution, we can see that the number of flu-related messages on May 18th, May 19th, May 20th are significantly larger than the previous date. The number of flu-related messages peaked on May 19th. Thus, we can easily conclude that the epidemic outbroke on May 18th.
Distribution of Flu-related Messages By Date
To further identify the origin and the specific time of the outbreak, we can further check the geographical distribution of flu-related messages on May 18th by hour and the heatmap on hourly basis as shown below.
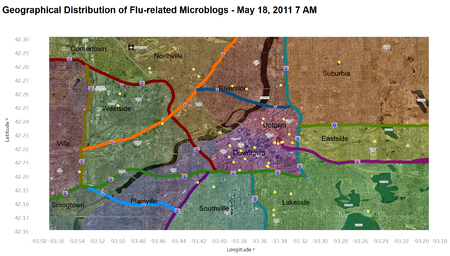
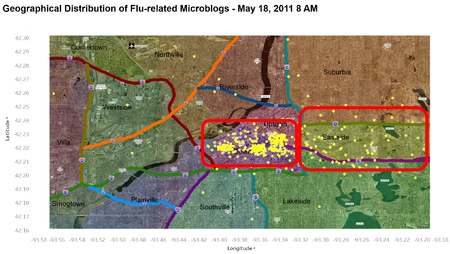
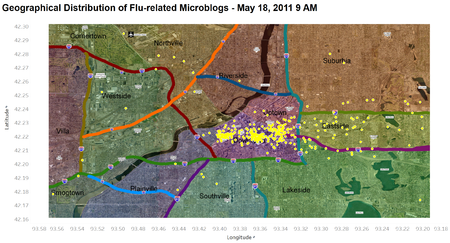
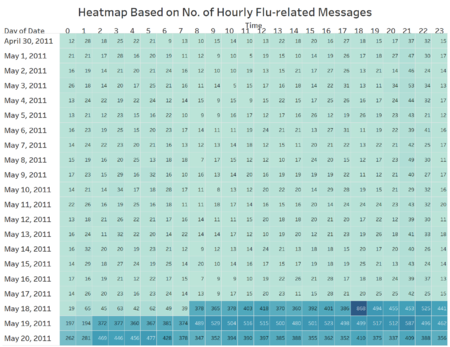
From the heatmap and geographical distribution of flu-related messages (One yellow point stands for one flu-related message from one user) from 7am to 10am on May 18th, we can see that the number of flu-related microblogs suddenly increased significantly between 8am to 9am on May 18th and kept stable between 9am to 10am and these messages mainly concentrated in the zone of Downtown, Uptown and Eastside, especially the Downtown and southern Uptown. In addition, these messages seem that they concentrated near the Vastopolis Dome (one stadium), Vastopolis City Hospital and Convention Centre.
After the outbreak at 8am, we can find that the epidemic suddenly expanded to the Vast River’s both sides mainly in the zone of Southern Westside and Plainville at 2AM on May 19th, 2011 as shown below.
This is another serious outbreak.
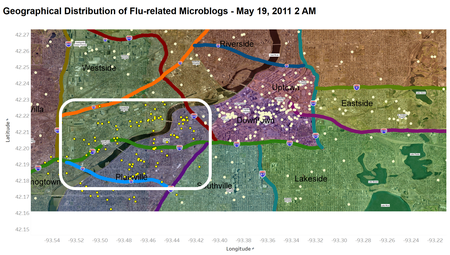
In this epidemic, the main affected areas have been highlighted in the red rectangle on May 18th and in the white rectangle on May 19th respectively above. The most affected area is Downtown and the river sides in Westside and Plainville.
Question 2: Epidemic Spread
#2.1 Present a hypothesis on how the infection is being transmitted. For example, is the method of transmission person-to-person, airborne, waterborne, or something else? Identify the trends that support your hypothesis. (Please limit your answer to ten images and 1000 words.)
Hypothesis: The method of transmission is airborne, person-to-person and waterborne respectively at different outbreaks/periods, which is based on the following reasoning.
From previous analysis, we already know that the epidemic outbroke from May 18th onwards. Thus, firstly, based on the TOP three percentage of change of number of flu-related messages on an hourly basis from May 18th to May 20th as shown below, three relatively significant outbreaks can be detected. Then, these three outbreaks will be analysed respectively in the following sections to observe the spread of the epidemic and the transmission method.
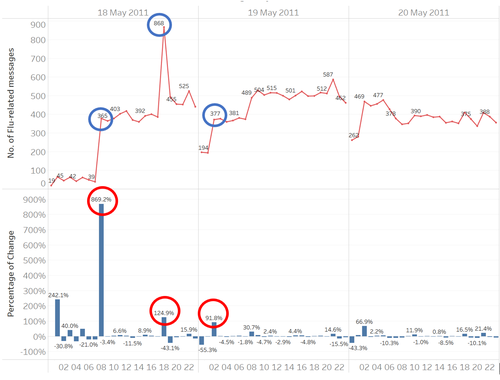
Hourly Number of Flu-related Messages and Hourly Percentage of Change From May 18th to May 20th
From the graph above, we can find that these three outbreaks took place at the following three point of time:
• 08:00-09:00 May 18th, 2011
• 18:00-19:00 May 18th, 2011
• 02:00-03:00 May 19th, 2011
# 1st outbreak: 08:00-09:00 May 18th, 2011:

From the weather dataset, we know that the wind direction on May 18th is west. From the graph above, we can see that the flu-related messages suddenly increased significantly from 7am(to 8am) to 8am(to 9am) and the affected area expanded from Downtown to Eastside, which is completely consistent with the wind direction. Thus, we can infer that the method of transmission is airborne in this outbreak.
#2nd outbreak: 18:00-19:00 May 18th, 2011:

From the graph above, we can see that the epidemic still concentrated on Downtown and Eastside at 5PM on May 18th but the epidemic suddenly outbroke again and has roughly spread to all directions at 6PM, which is not consistent with the wind direction. Obviously, in this outbreak, the transmission of the epidemic is not by wind.
From the population statistics, we can know that Downtown is the most densely populated area in the day. And the time 5PM to 7PM is almost the time for people to get out of office to go back home. Thus, the movement of the population is very likely to prompt the epidemic spread to all directions. I suppose that the transmission is person-to-person in this outbreak.
#3rd outbreak: 02:00-03:00 May 19th, 2011:

From the graph above, we can see that the epidemic still concentrated on Downtown 1AM on May 19th but the epidemic spread to the river sides in Southern Westside and Plainville at 2AM, which is also obviously not consistent with the wind direction (WNW) on May 19th, 2011. We can easily see that the flu-related messages concentrated along the Vast River at 2AM.
In addition, from the additional information, we can also know that the residents and businesses get their drinking water by pumping water from nearby reservoirs or rivers.
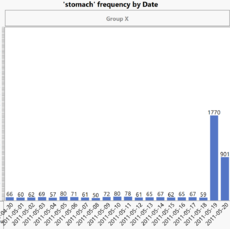
Besides, from the word cloud of the messages as shown below, the word ‘stomach’ becomes very frequent on May 19th while its frequency is very low on May 18th (See the distribution below). From the further check in the text, ‘stomach’ indicated the ‘stomach ache’ in the messages (See the sample text below). And I found that the word like ‘diarrhea’, ‘pneumonia’ has already started on May 19th but they are widely used on May 20th, that’s why they didn’t appear on the word cloud until May 20th(See the word cloud below).


Sample of Messages with text 'stomach'
From the reasoning above, we can infer that people near the river sides drink the water from the river polluted by the pathogen which leads to this epidemic spread so that people along the riverside collectively had the stomach-related symptoms mentioned above. Thus, the infection in the third outbreak is transmitted by water.
Overall, we can conclude that the infection is transmitted by wind, by water and person-to-person from the reasoning of all these three outbreaks above. However, there may be many other factors directly affecting the observed patterns mentioned above, which can lead to the wrong conclusions and needs further discussion and investigation.
#2.2 Is the outbreak contained? Is it necessary for emergency management personnel to deploy treatment resources outside the affected area? Explain your reasoning. (Please limit your answer to ten images and 1000 words. )
Conclusions: The outbreak hasn’t been contained and it’s still necessary for emergency management personnel to deploy treatment resources outside the affected area.
From the distribution of flu-related messages below, we can see that although the flu-related messages drop from 10750 (May 19th) to 9194 (May 20th), by 14.5%, the number is still much higher than May 17th and before the epidemic outbreak.
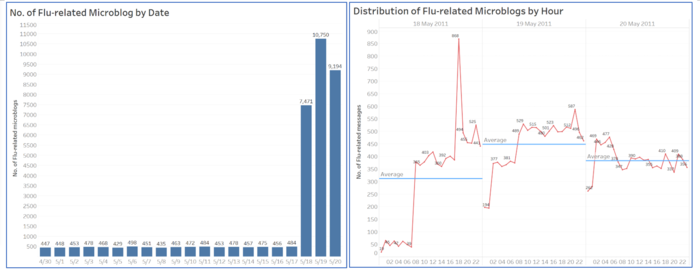
In addition, on May 20th, although the hourly messages level is stable, there are still half of the hourly messages higher than the average hourly level, especially on 2AM-3AM and 5AM-6AM, whose levels are even higher than the average hourly level on May 19th.
With the help of Tabulate in JMP Pro, the number of post messages for each user during May 18th to May 20th can be derived as shown below. From the perspective of new report cases, 5131 users didn’t post the microblog on May 18th and May 19th but post on May 20th, which reflects these 5131 users are the new report cases on May 20th. So many new report cases on May 20th illustrates that the epidemic hasn’t been contained at all on May 20th.
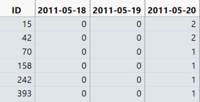
Number of post flu-related messages for each user from May 18th to May 20th
Therefore, it is concluded that it is still necessary for emergency management personnel to deploy treatment resources outside the affected area before the reported illness decreased to a specific acceptable level, since the regional spread of the outbreak is not contained.

