Difference between revisions of "ISSS608 2017-18 T1 Assign ZHANG LIDAN"
| (14 intermediate revisions by the same user not shown) | |||
| Line 1: | Line 1: | ||
| − | <div style= | + | <div style=background:#2B3820 border:#A3BFB1> |
| + | [[Image:title_momo.png|150px]] | ||
| + | <font size = 5; color="#FFFFFF">Epidemic Spread in Smartpolis</font> | ||
| + | </div> | ||
| + | <!--MAIN HEADER --> | ||
| + | {|style="background-color:#1B338F;" width="100%" cellspacing="0" cellpadding="0" valign="top" border="0" | | ||
| + | | style="font-family:Century Gothic; font-size:100%; solid #000000; background:#B0620E; text-align:center;" width="25%" | | ||
| + | ; | ||
| + | [[ISSS608_2017-18_T1_Assign_ZHANG_LIDAN| <font color="#FFFFFF">Background</font>]] | ||
| − | == | + | | style="font-family:Century Gothic; font-size:100%; solid #1B338F; background:#2B3820; text-align:center;" width="25%" | |
| + | ; | ||
| + | [[ISSS608_2017-18_T1_Assign_ZHANG_Lidan_Data_Preparation| <font color="#FFFFFF">Data Preparation</font>]] | ||
| − | = | + | | style="font-family:Century Gothic; font-size:100%; solid #1B338F; background:#2B3820; text-align:center;" width="25%" | |
| − | + | ; | |
| − | + | [[ISSS608_2017-18_T1_Assign_ZHANG_Lidan_Visualization| <font color="#FFFFFF">Data Visualization</font>]] | |
| − | |||
| − | |||
| − | |||
| − | |||
| − | |||
| − | |||
| − | |||
| − | |||
| − | |||
| − | |||
| − | [[ | ||
| − | == | + | | style="font-family:Century Gothic; font-size:100%; solid #1B338F; background:#2B3820; text-align:center;" width="25%" | |
| + | ; | ||
| + | [[ISSS608_2017-18_T1_Assign_ZHANG_Lidan_Conclusion| <font color="#FFFFFF">Conclusion</font>]] | ||
| + | | | ||
| + | |} | ||
| + | <br/> | ||
| + | ==Background== | ||
| + | ===Motivation=== | ||
| + | Smartpolis is a major metropolitan area with a population of approximately two million residents. During the last few days, health professionals at local hospitals have noticed a dramatic increase in reported illnesses.<br/> | ||
| + | Observed symptoms are largely flulike and include fever, chills,sweats, aches and pains, fatigue, coughing, breathing difficulty, nausea and vomiting, diarrhea, and enlarged lymph nodes. More recently, there have been several deaths believed to be associated with the current outbreak. City officials fear a possible epidemic and are mobilizing emergency management resources to mitigate the impact. <br/> | ||
| + | To clearly explore the origin and epidemic spread in Smartpolis, it is essential to identify approximately where the outbreak started on the map (ground zero location) and outline the affected area.<br/> | ||
| + | In addition, it is needed to present a hypothesis on how the infection is being transmitted. For example, is the method of transmission person-to-person, airborne, waterborne, or something else? Is the outbreak contained? Is it necessary for emergency management personnel to deploy treatment resources outside the affected area? | ||
| − | == | + | ===About Dataset=== |
| + | There are 3 datasets given in csv format and one map in png format.<br/> | ||
| + | [[File:Dataset.PNG|200px]] | ||
| + | * Microblog<br/> | ||
| + | Attributes:<br/> | ||
| + | ID – personal identifier of the individual posting the message<br/> | ||
| + | Created_at – date and time of the post<br/> | ||
| + | Location – latitude and longitude coordinates of the mobile device at the time of post<br/> | ||
| + | Text – the posted message<br/> | ||
| + | [[File:Microblogs.PNG|400px]] | ||
| + | * Population<br/> | ||
| + | Attributes:<br/> | ||
| + | Zone_Name – the name of one of the 13 city zones within the metropolitan area<br/> | ||
| + | Population_Density – the number of residents in the zone<br/> | ||
| + | Daytime_Population – the estimated population in the zone due to commuting during work hours<br/> | ||
| + | [[File:Weather.PNG|200px]] | ||
| + | * Weather<br/> | ||
| + | Attributes:<br/> | ||
| + | Date – date of observed weather by weather station<br/> | ||
| + | Weather – weather conditions for a particular day<br/> | ||
| + | Average_Wind_Speed – measured in miles per hour<br/> | ||
| + | Wind_Direction – the direction from which the wind is blowing or from which it originates<br/> | ||
| + | [[File:Population.PNG|250px]] | ||
| + | * Smartpolis<br/> | ||
| + | Attributes:<br/> | ||
| + | Longitude: -93.5673W ~ -93.1923W<br/> | ||
| + | Latitude: 42.3017N ~ 42.1609N<br/> | ||
| + | [[File:MAP.PNG|400px]] | ||
| + | ===Tools Application=== | ||
| + | * JMP 13: Data pre-processing<br/> | ||
| + | * Tableau 10.3: Data Visualization<br/> | ||
| + | ===Work Flow=== | ||
| + | [[Image:workflow.PNG|600px]] | ||
Latest revision as of 17:27, 15 October 2017
|
|
|
|
|
Background
Motivation
Smartpolis is a major metropolitan area with a population of approximately two million residents. During the last few days, health professionals at local hospitals have noticed a dramatic increase in reported illnesses.
Observed symptoms are largely flulike and include fever, chills,sweats, aches and pains, fatigue, coughing, breathing difficulty, nausea and vomiting, diarrhea, and enlarged lymph nodes. More recently, there have been several deaths believed to be associated with the current outbreak. City officials fear a possible epidemic and are mobilizing emergency management resources to mitigate the impact.
To clearly explore the origin and epidemic spread in Smartpolis, it is essential to identify approximately where the outbreak started on the map (ground zero location) and outline the affected area.
In addition, it is needed to present a hypothesis on how the infection is being transmitted. For example, is the method of transmission person-to-person, airborne, waterborne, or something else? Is the outbreak contained? Is it necessary for emergency management personnel to deploy treatment resources outside the affected area?
About Dataset
There are 3 datasets given in csv format and one map in png format.

- Microblog
Attributes:
ID – personal identifier of the individual posting the message
Created_at – date and time of the post
Location – latitude and longitude coordinates of the mobile device at the time of post
Text – the posted message

- Population
Attributes:
Zone_Name – the name of one of the 13 city zones within the metropolitan area
Population_Density – the number of residents in the zone
Daytime_Population – the estimated population in the zone due to commuting during work hours

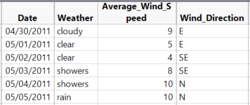
- Weather
Attributes:
Date – date of observed weather by weather station
Weather – weather conditions for a particular day
Average_Wind_Speed – measured in miles per hour
Wind_Direction – the direction from which the wind is blowing or from which it originates

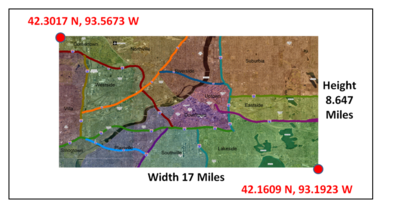
- Smartpolis
Attributes:
Longitude: -93.5673W ~ -93.1923W
Latitude: 42.3017N ~ 42.1609N

Tools Application
- JMP 13: Data pre-processing
- Tableau 10.3: Data Visualization

