Difference between revisions of "ISSS608 2017-18 T1 Assign ZHANG PENG"
| Line 76: | Line 76: | ||
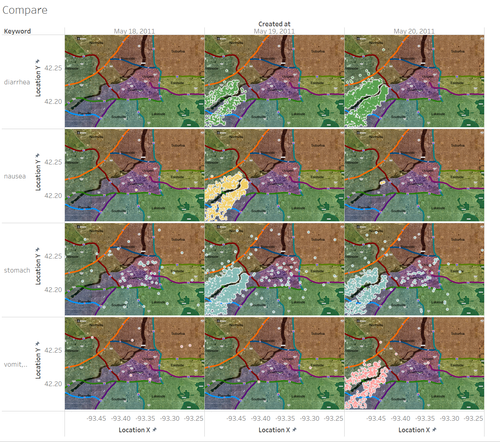
<p align="justify">Conclusion1: The first affected area is clustered near the centre as Uptown, Downtown. The symptom is like flu. | <p align="justify">Conclusion1: The first affected area is clustered near the centre as Uptown, Downtown. The symptom is like flu. | ||
However, other different partial symptoms are clustered near downstream in Southville and Smogtown on May 19 and May 20. They are diarrhea, nausea, stomach and vomit. We find out that it is a like stomach-ache symptom. (Figure4) </p> | However, other different partial symptoms are clustered near downstream in Southville and Smogtown on May 19 and May 20. They are diarrhea, nausea, stomach and vomit. We find out that it is a like stomach-ache symptom. (Figure4) </p> | ||
| + | <p> | ||
| + | [[File:ZP FINDING4.png|left|Figure 4|500 px]] | ||
| + | </p> | ||
</td></tr> | </td></tr> | ||
</table> | </table> | ||
<!--- Discussion ---> | <!--- Discussion ---> | ||
Revision as of 14:38, 15 October 2017
Contents
VAST Challenge: Characterization of an Epidemic Spread
assignment overview
- Identify approximately where the outbreak started on the map (ground zero location). Outline the affected area.
- Present a hypothesis on how the infection is being transmitted. For example, is the method of transmission person-¬to¬-person, airborne, waterborne, or something else? Identify the trends that support your hypothesis.
- Is the outbreak contained? Is it necessary for emergency management personnel to deploy treatment resources outside the affected area?
Data Description
xxx
Dataset Overview
| 1 dataset1 | 2 dataset2 |
| xxx | xxx |
Data Preparation
Interactive Visualization
You may have your own investigation here: link
Question 1
|
1. Filter keywords from Microblogs texting I chose observed symptoms as keywords to filter out related Microblogs by using JMP. The observed symptoms contain chills, sweats, aches and pains, fatigue, coughing, breathing difficulty, nausea and vomiting, diarrhea, and enlarged lymph nodes. I use the symptom-related keywords and frequency of these words to improve accuracy. |
|
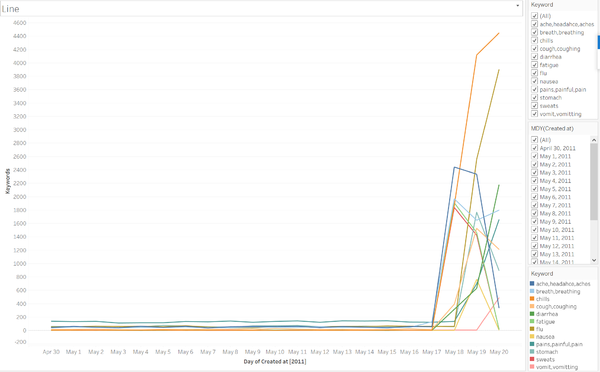
2. Find out the outbreak time We can find all the symptoms are sharply increased from May 18 and partial from May 19 in below line-chart. I only need to do deep analysis from May 17 to May 20. |
|
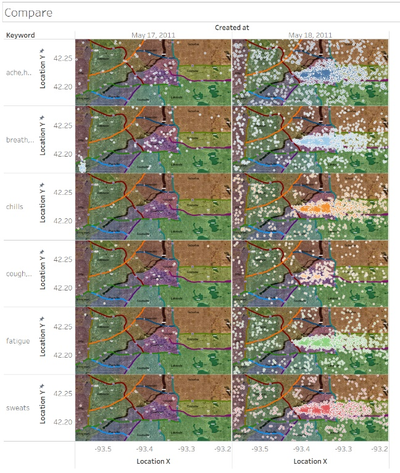
3. Find out the affected areas The symptom words used on May 18 are related to aches, breath, chills, cough, fatigue and sweats. These symptoms outbroke mainly in Uptown, Downtown and Eastside. |
|
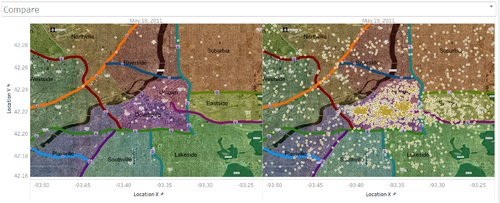
The symptom in Uptown, Downtown and Eastside is like flu. So that on May 19, in the same place, the word ‘flu’ was used more frequently. (Figure3: Compare flu frequency on May 18 and May 19).
|
|
Conclusion1: The first affected area is clustered near the centre as Uptown, Downtown. The symptom is like flu. However, other different partial symptoms are clustered near downstream in Southville and Smogtown on May 19 and May 20. They are diarrhea, nausea, stomach and vomit. We find out that it is a like stomach-ache symptom. (Figure4)
|


