Difference between revisions of "ISS608 2017-18 T1 Assign KyonghwanKim Data Preparation"
Jump to navigation
Jump to search
Kh.kim.2016 (talk | contribs) |
Kh.kim.2016 (talk | contribs) |
||
| Line 37: | Line 37: | ||
=Microblog= | =Microblog= | ||
| + | ==1. Data cleaning== | ||
{| class="wikitable" | {| class="wikitable" | ||
| Line 50: | Line 51: | ||
|'''2. Outliers'''<br/> | |'''2. Outliers'''<br/> | ||
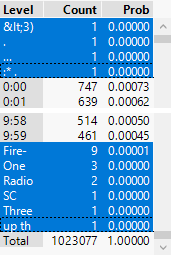
*There are 21 items with invalid time format. They are removed from analysis.<br/> | *There are 21 items with invalid time format. They are removed from analysis.<br/> | ||
| + | |||
| + | |||
| + | |||
| + | |||
| + | |||
| + | |||
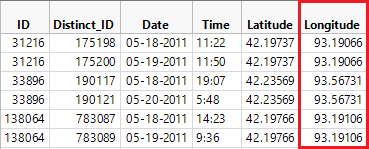
*Also, there are 6 items with Longitude outside of given map range. They are removed as well so that all data are within parameters. | *Also, there are 6 items with Longitude outside of given map range. They are removed as well so that all data are within parameters. | ||
| + | *Total 27 rows are removed and 1,023,050 rows are used for analysis. | ||
|[[file:missing_time.png]][[file:outlier_Longitude.png]] | |[[file:missing_time.png]][[file:outlier_Longitude.png]] | ||
|- | |- | ||
|} | |} | ||
Revision as of 03:21, 15 October 2017
Vastropolis Epidemic Report
|
|
|
|
|
|
|


