ISSS608 2016-17 T3 Assign DEBASISH BEHERA DataPrep
|
|
|
|
|
Meteorological Data
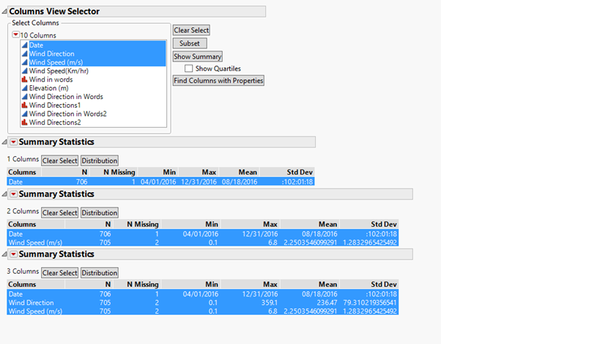
The meteorological data was checked for any missing values.
We found here that there are two missing values for the wind direction. These missing values were removed for our subsequent analysis.
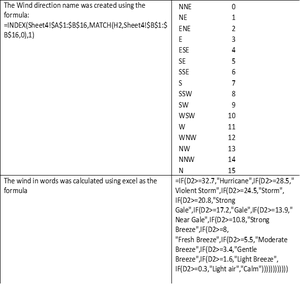
The meteorological table was added with two columns that described the wind direction and the wind speed using formulas in excel.
Sensor Data
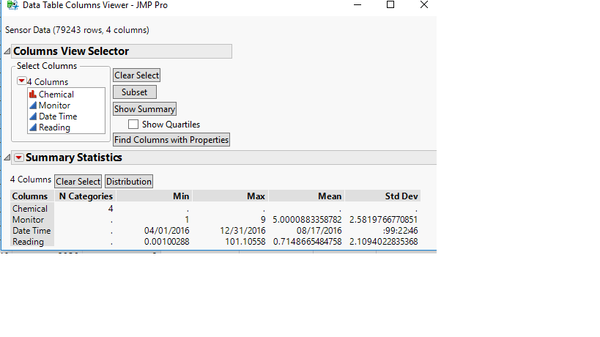
There are no missing values that can be observed for the sensor data.
Sensor Coordinate Table
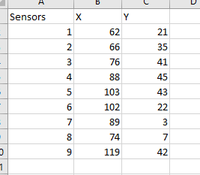
The Sensor Coordinate table was made by inputting the coordinates in excel and creating one excel file know as sensor coordinates
Preparing the Data for Wind Fan
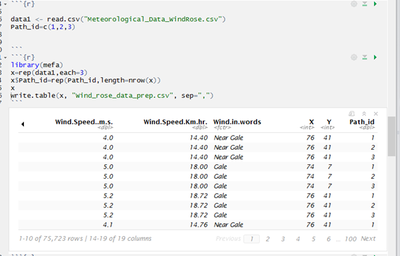
For preparing the data for constructing the wind fan, the data set known as Meteorological_Data_windrose.csv was created by using the table meteorological data, sensor data and the sensor coordinates.
After we have prepared the data then we use R to replicate each row 3 times and give a path ID. The table created was known as wind_rose_data_prep.csv

